I Put a Multimeter on the Dominus Extreme's Probe Points — Idle vs Load
Hey guys, it’s been a while. Finally back. I’ve been working on some crazy projects lately and will be posting much more.
Today we’re focusing on the Dominus, because I’ve never seen anyone actually post the voltages off the probe points. I couldn’t find any other post with these voltages, so I went and measured them myself.
Fair warning: I’m a 19-year-old with a cheap multimeter and one board. Where I know something, I’ll say so. Where I’m guessing, I’ll say that too.
The machine
The board and CPU are the ones from the VRM headroom post and the phase shedding post.
- CPU: Xeon W-3175X
- Board: ASUS ROG Dominus Extreme
- RAM: 96 GB (12× 8 GB B-die) at 3600 CL15
- GPU: Quadro GP100
- PSU and cooling: an EVGA 1600 P+ and an Alphacool Pro Aurora 360 AIO, both visible in the picture
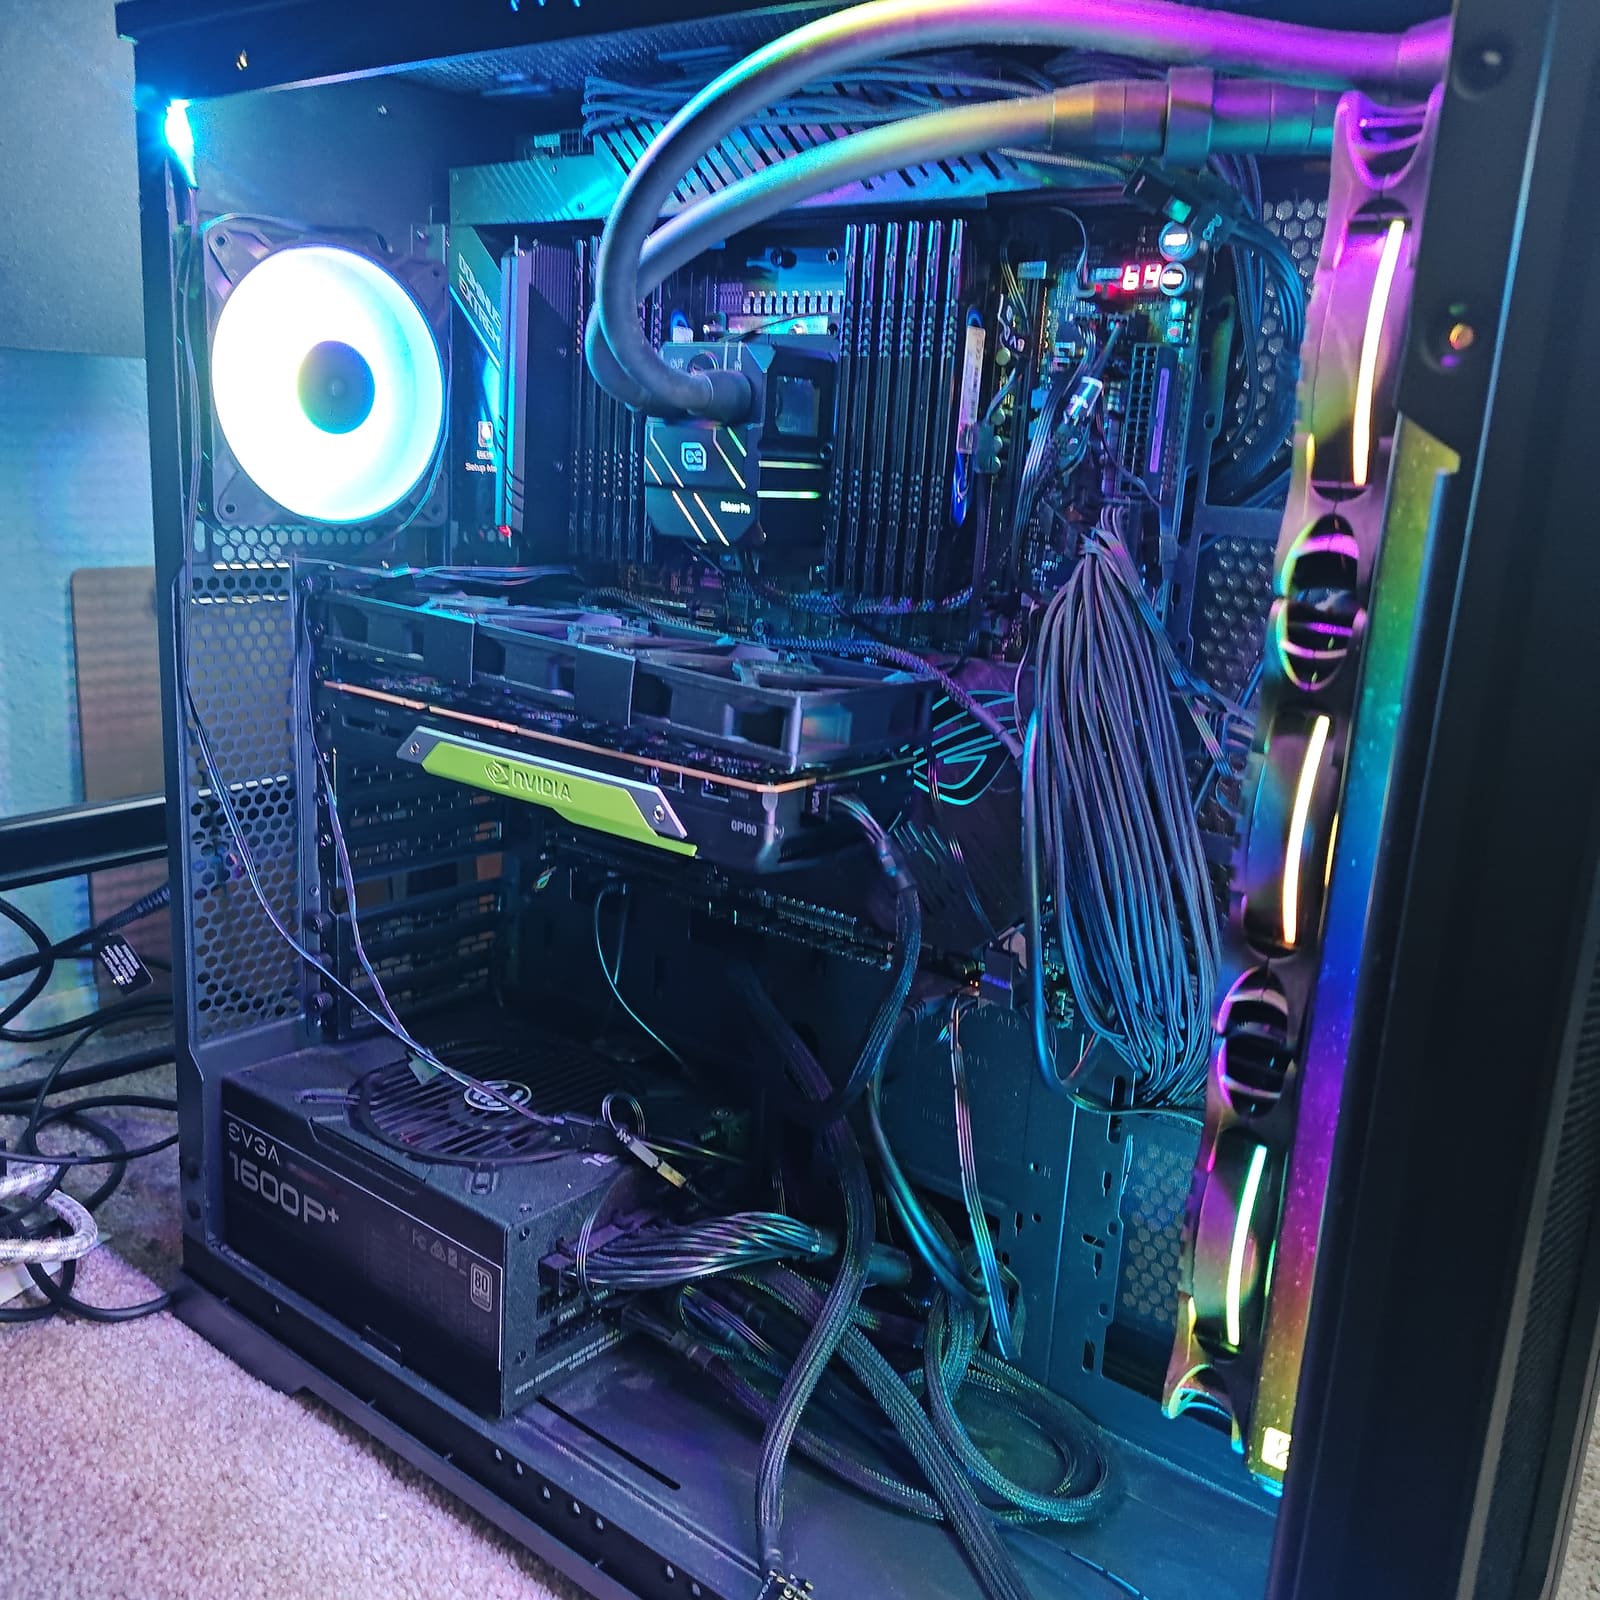
Side note: a second GP100 with NVLink may come later. No promises.
The multimeter
It’s an Etekcity multimeter. There’s no model printed on mine — the back sticker only has a lot code (US03022F18). The dial ranges match the Etekcity MSR-R500 manual, so that’s the spec sheet I’m using. The fuse markings on mine don’t line up with it, though (mine says 10A fused and 500 mA, the manual’s spec page says the 10A jack is un-fused and the mA fuse is 315 mA), so mine may be a close sibling. Treat the numbers below as the closest published ones, not a guarantee for my exact unit.
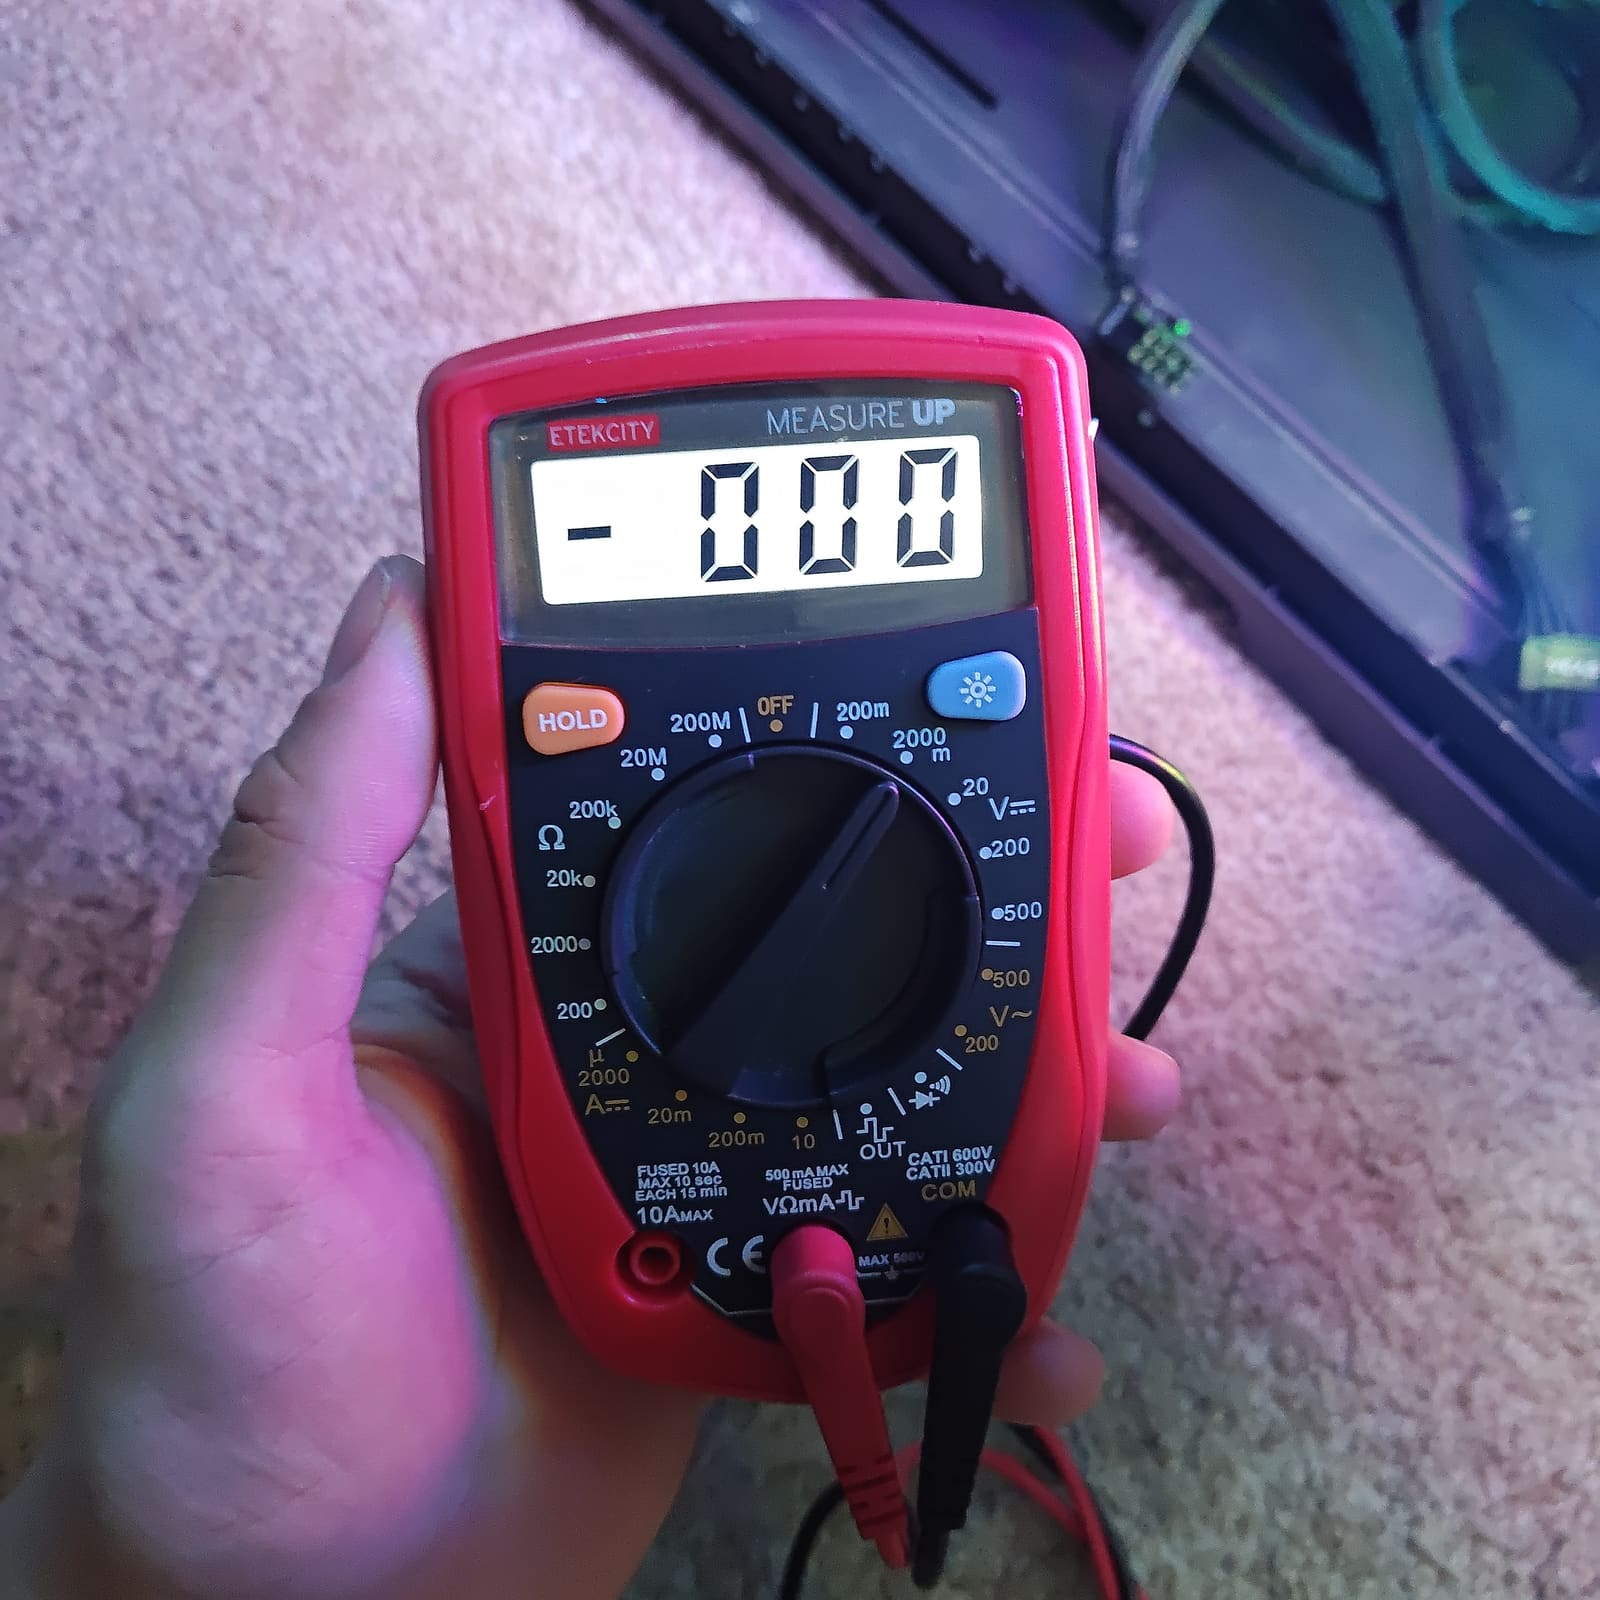
I ran everything on the 2000 mV DC range. That tops out just under 2 V, which covers everything here — my highest reading was 1.880 V. The R500 manual’s published spec for that range:
- Accuracy ±(0.5% + 2 digits), resolution 1 mV, input impedance 10 MΩ
- About 2–3 readings per second
Those are the model’s published numbers, not verified on my unit. They work out to roughly ±7 mV at 1.06 V and ±11 mV at 1.88 V. A lot of the differences below are inside that error bar.
The probe points
The Dominus has a row of test pads on the board’s edge, next to the 24-pin. ASUS calls it the Probelt, and it’s meant for exactly this: put a multimeter on a pad and read a voltage while the system runs.
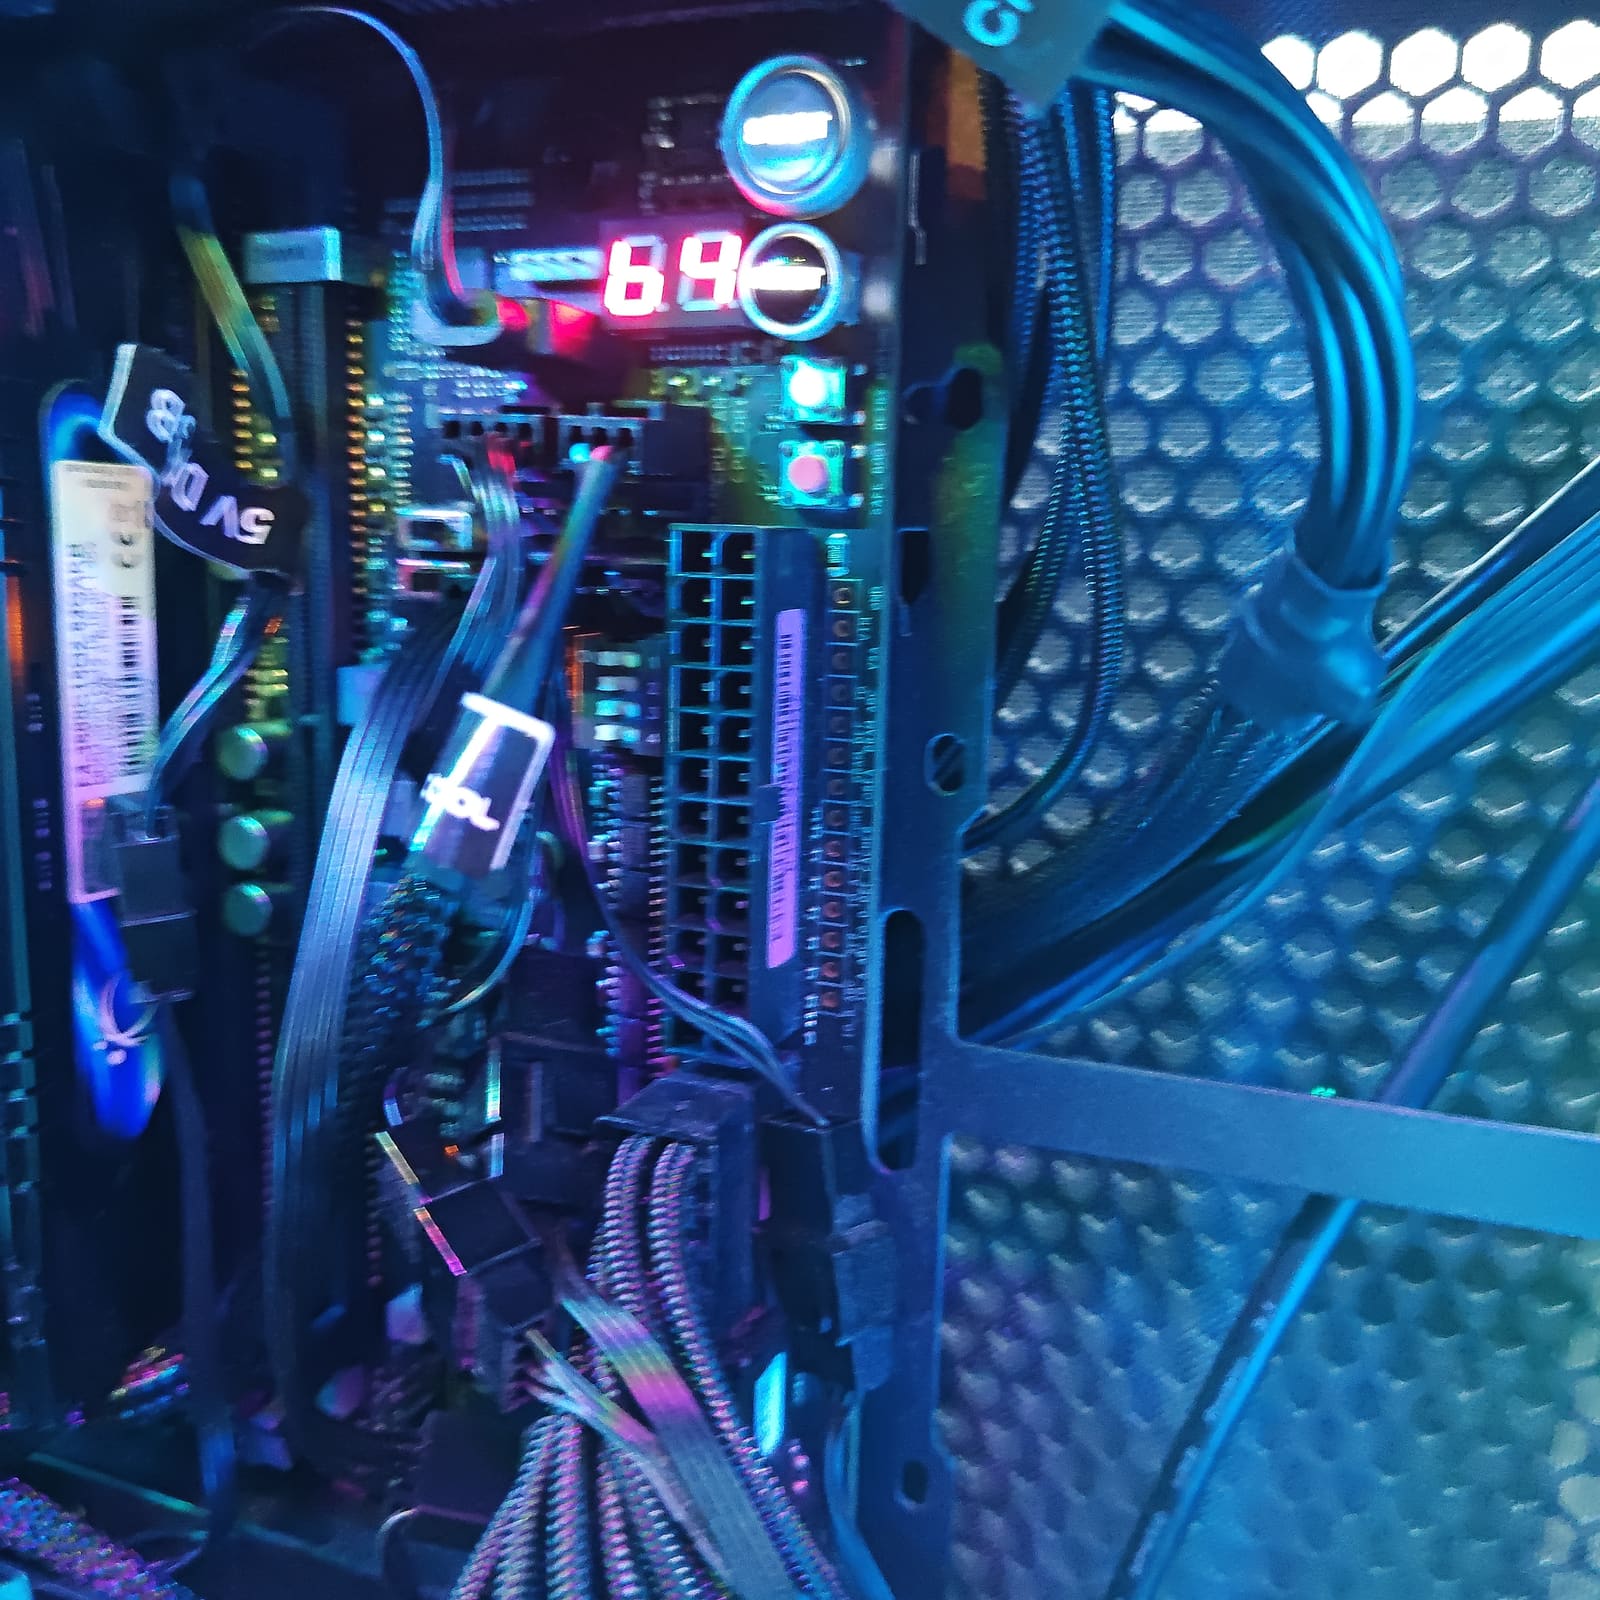
The manual is the guide I based everything on.
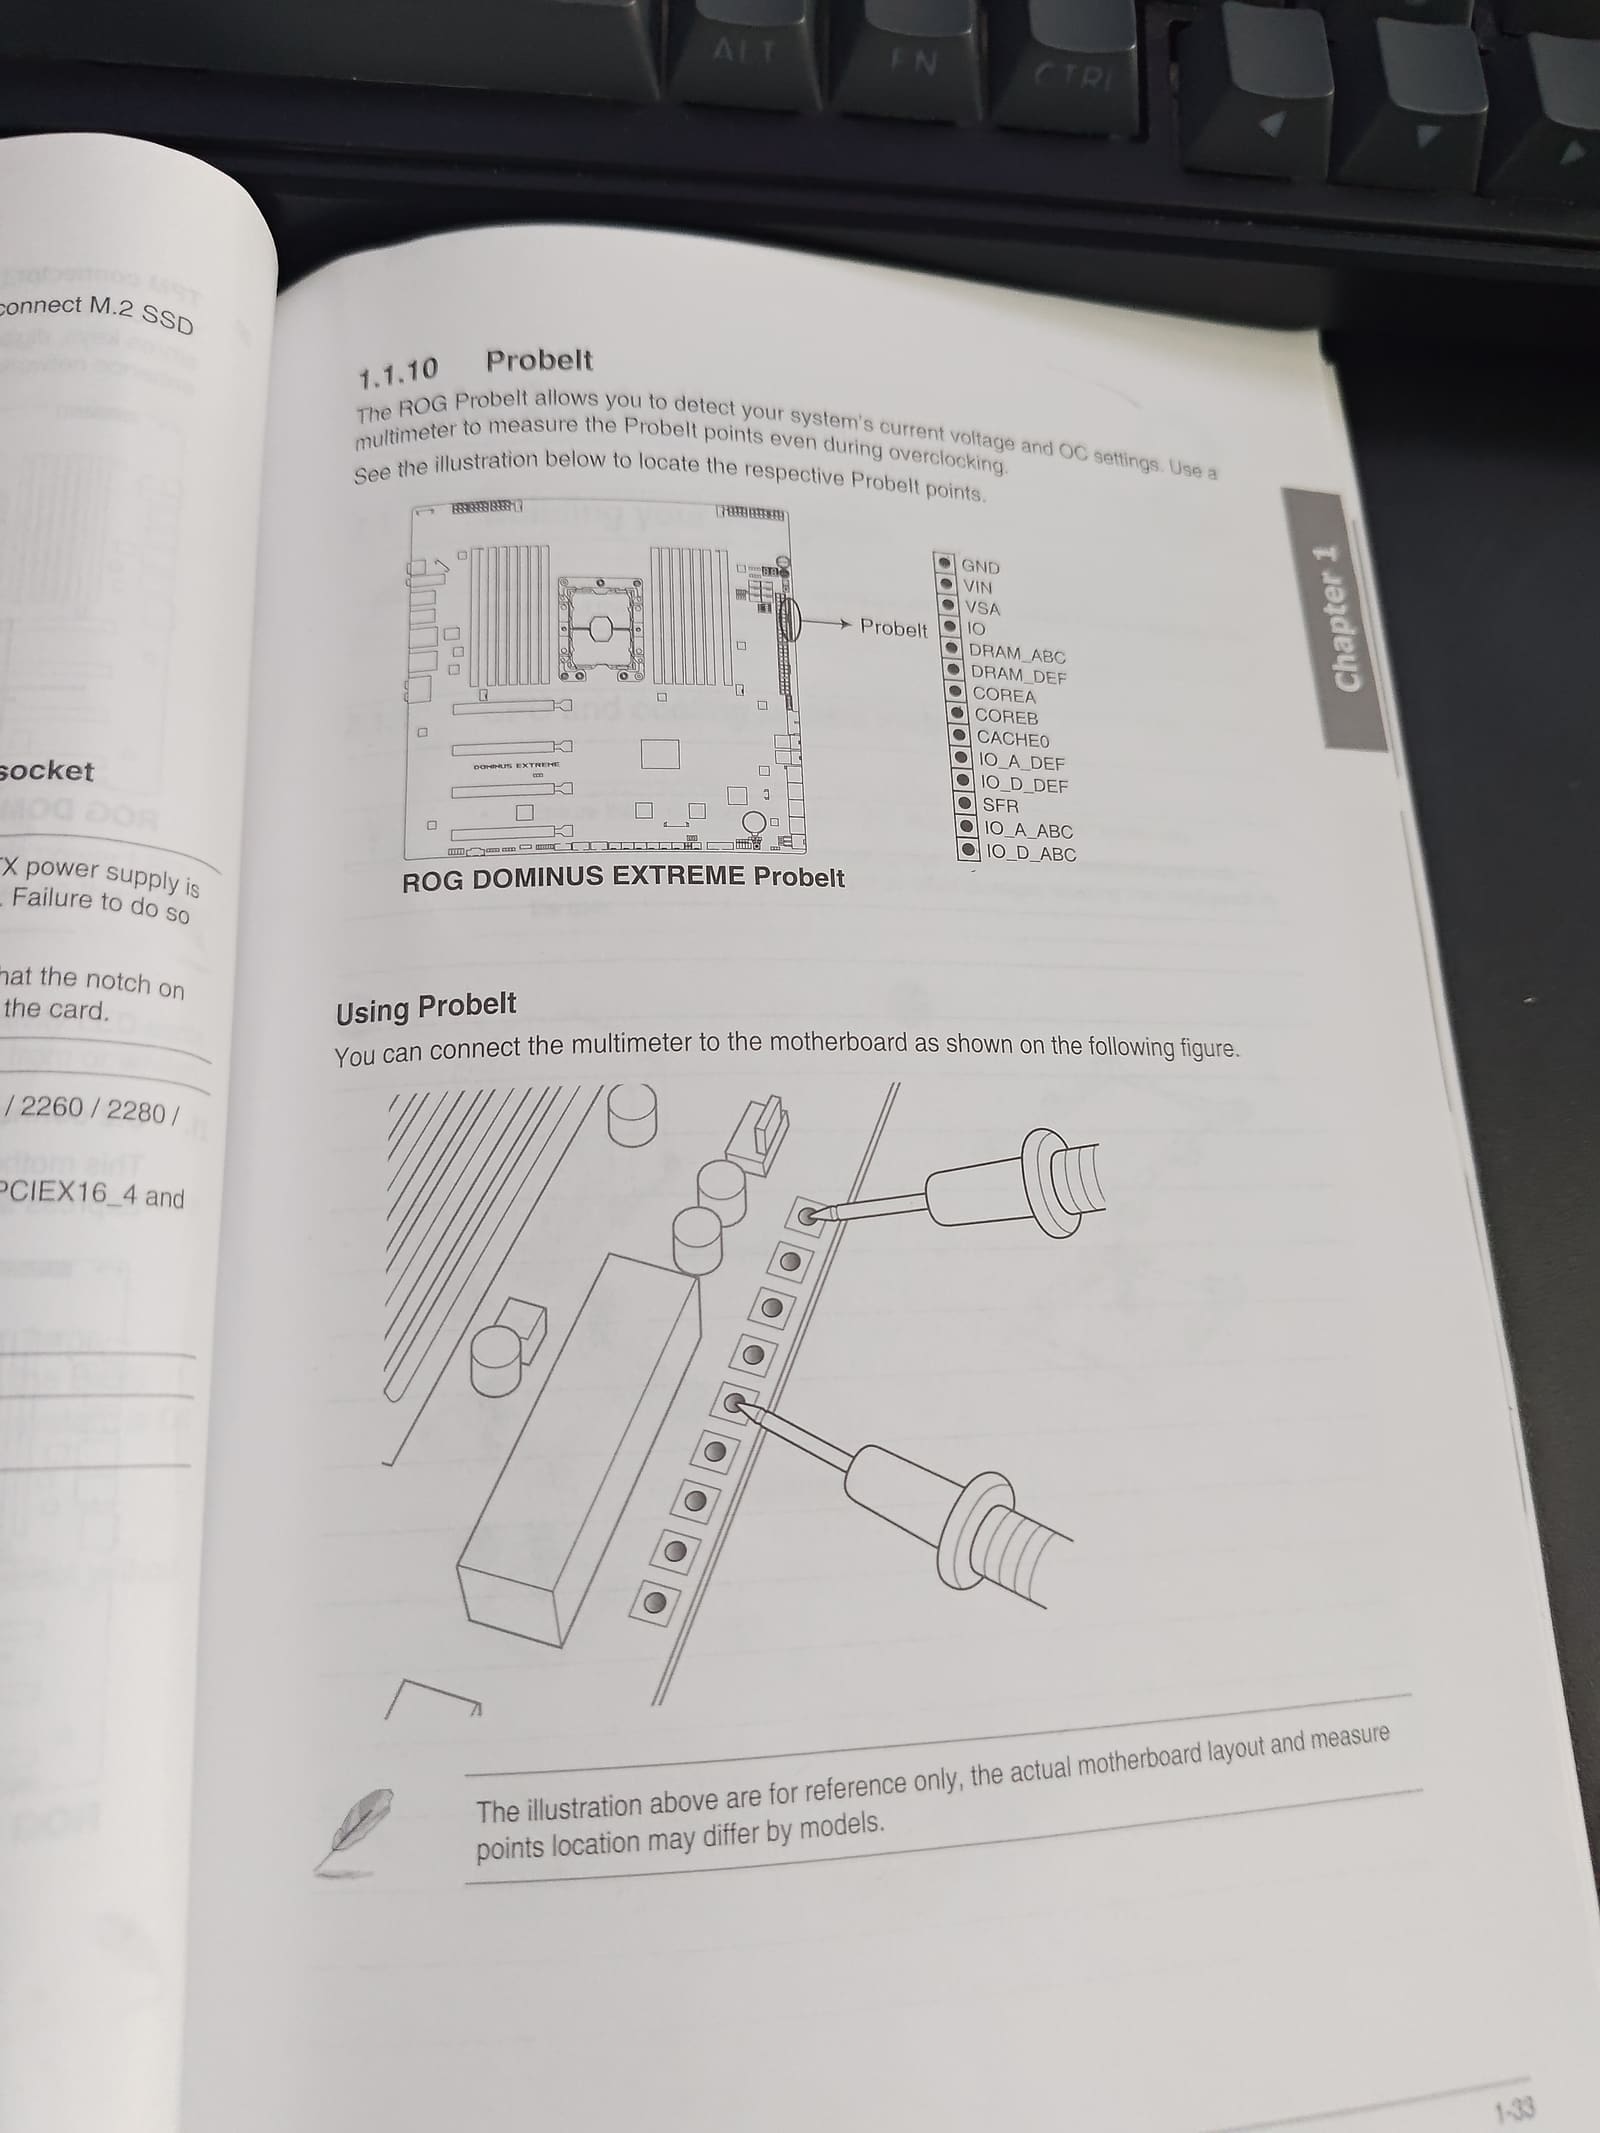
ASUS’s diagram, from the Dominus Extreme manual (p. 1-33).
The header is GND plus 13 pads. Here they are in the order ASUS prints them:
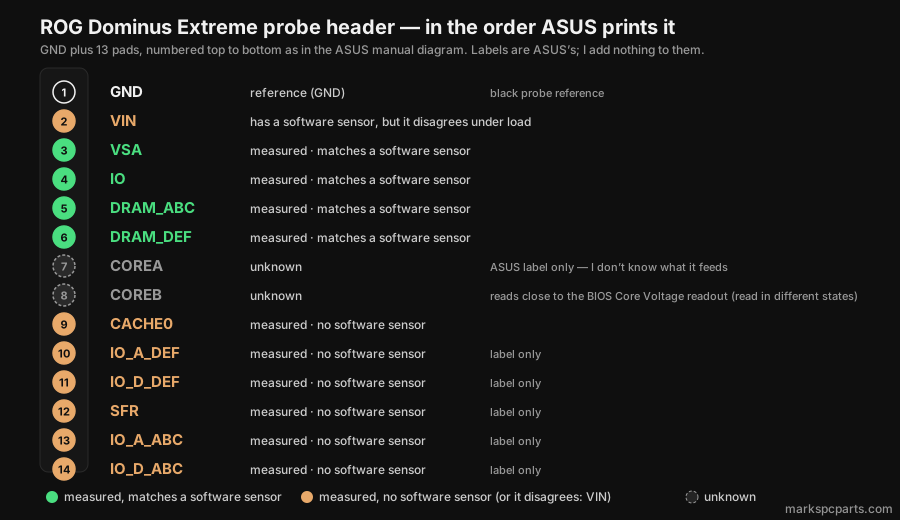
- I only use ASUS’s labels. I won’t tell you what a pad “really” is when ASUS doesn’t say.
- IO_A / IO_D: label only.
- SFR is label only. More on that below.
- COREA and COREB are grey (“unknown”). I measured both, but I don’t know what each feeds. COREB’s reading lines up loosely with the BIOS Core Voltage readout (more on that below).
- VIN has a software sensor, but it disagrees under load.
Black probe on pad 1 (GND) as the reference, red probe on whichever pad I was reading.
BIOS setup
Nine BIOS pictures, numbered 1–9 in my files. Here’s what matters:
| Setting | Value | Why it matters |
|---|---|---|
| BIOS / Intel ME | 0901 x64 (08/05/2024) / 11.22.86.1877 | The firmware all of this ran on |
| ASUS MultiCore Enhancement | Auto (it’s on) | I know it’s on, even though it just says Auto |
| CPU load-line calibration | Auto | A possible factor in the VIN result, untested |
| CPU / DRAM Power Phase Control | Extreme | Full phase mode — see the phase shedding post |
| DRAM Current Capability | 100% | |
| CPU cache ratio (mesh) | min 30 / max 30 | Mesh locked at 30x |
| XMP | On, DDR4-3603 15-16-16-36 | The RAM speed |
| CPU Current Reporting | Divide by 1.28 (Intel Spec) | Makes HWiNFO’s package power read ~400W instead of ~130W (closest to real draw, as far as I can tell) |
| Voltages | Mostly Auto; DRAM 1.4000 | What the DRAM pads are set to |
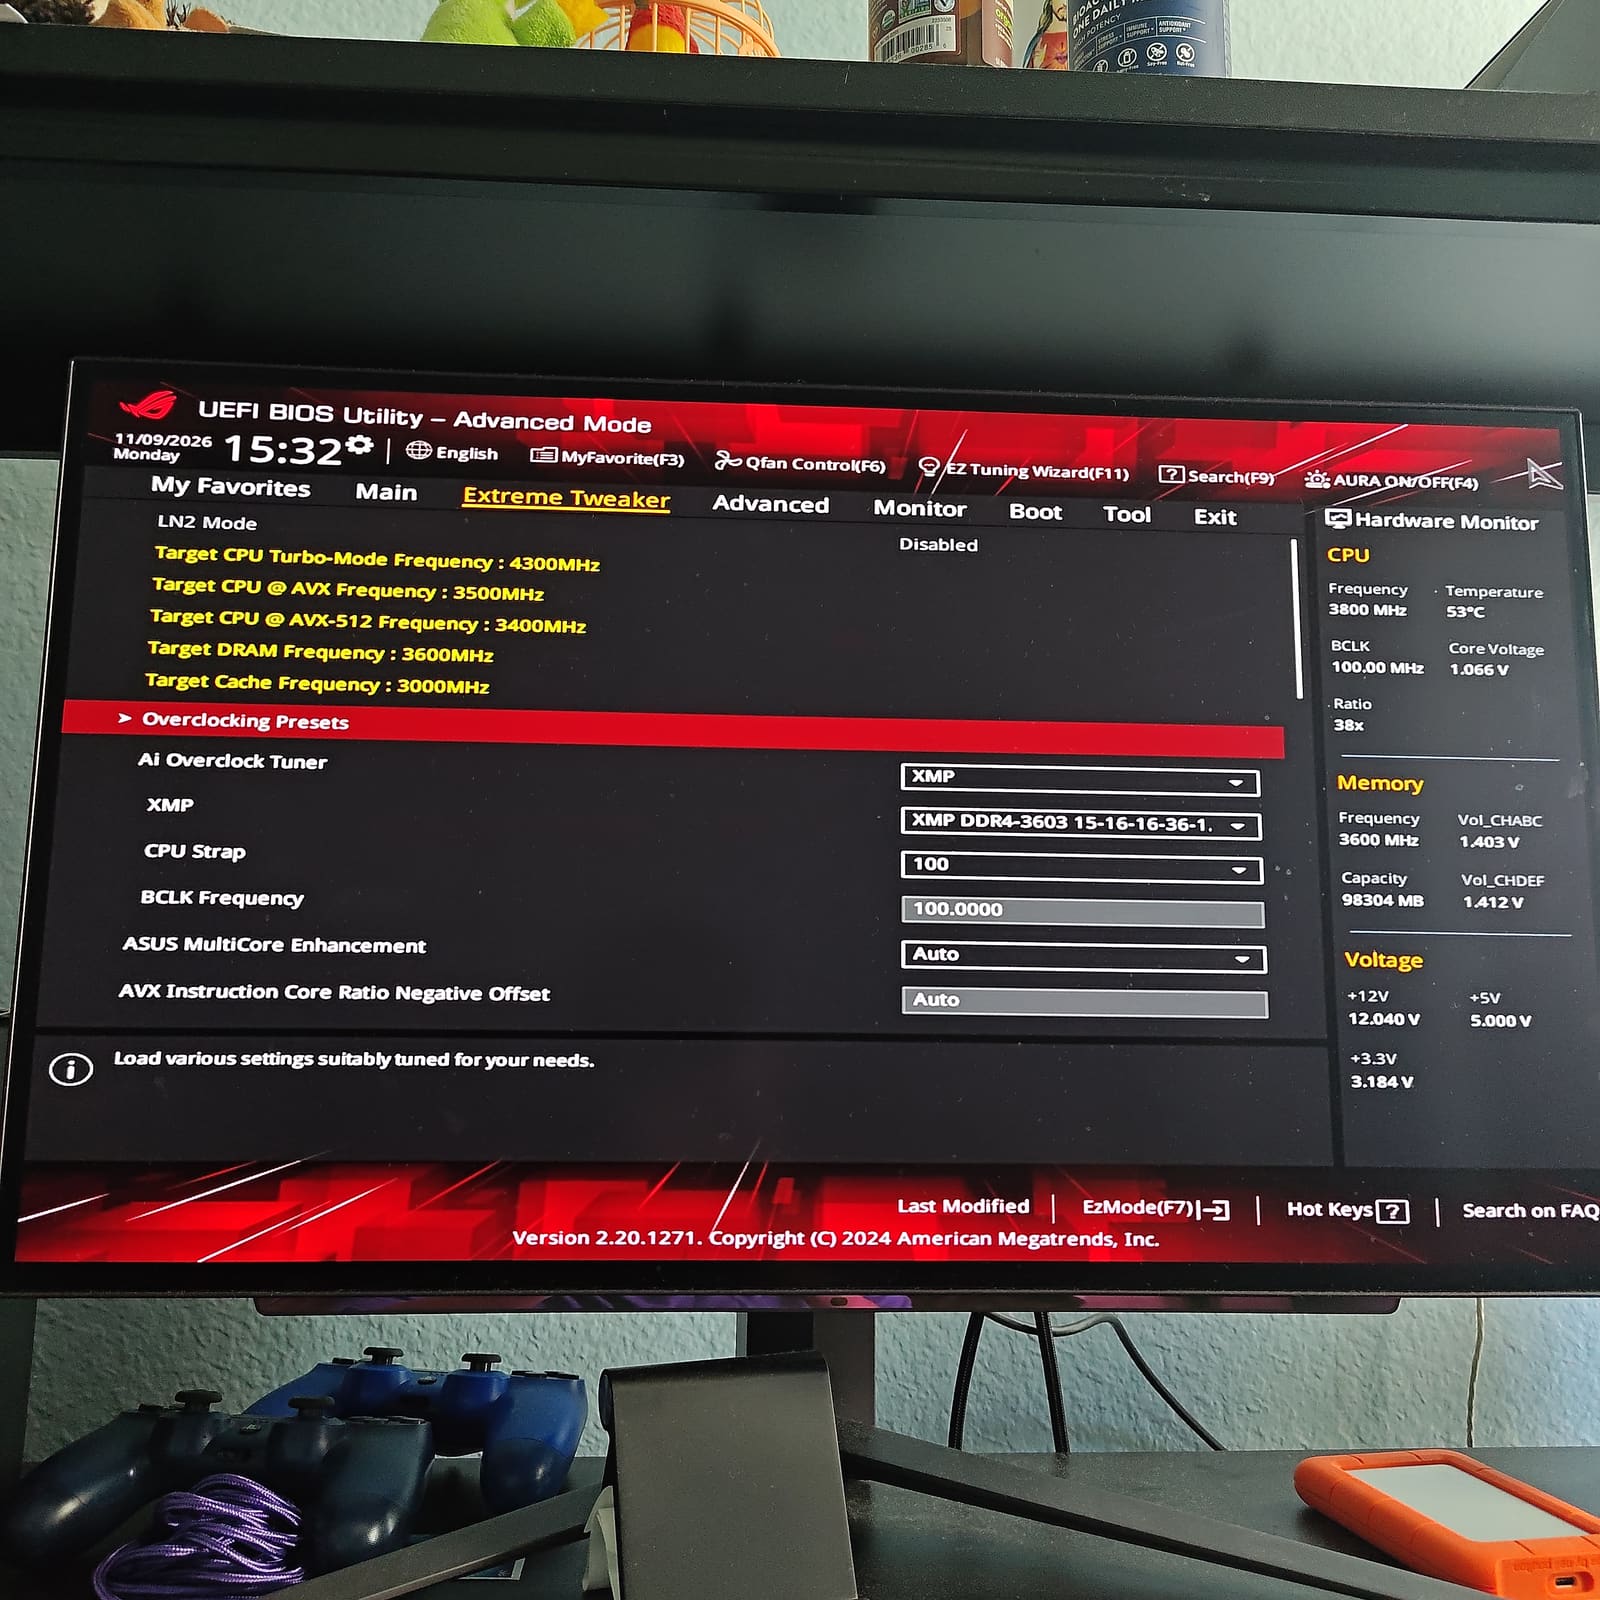
1 — Extreme Tweaker: XMP on, BCLK 100, MCE on Auto.
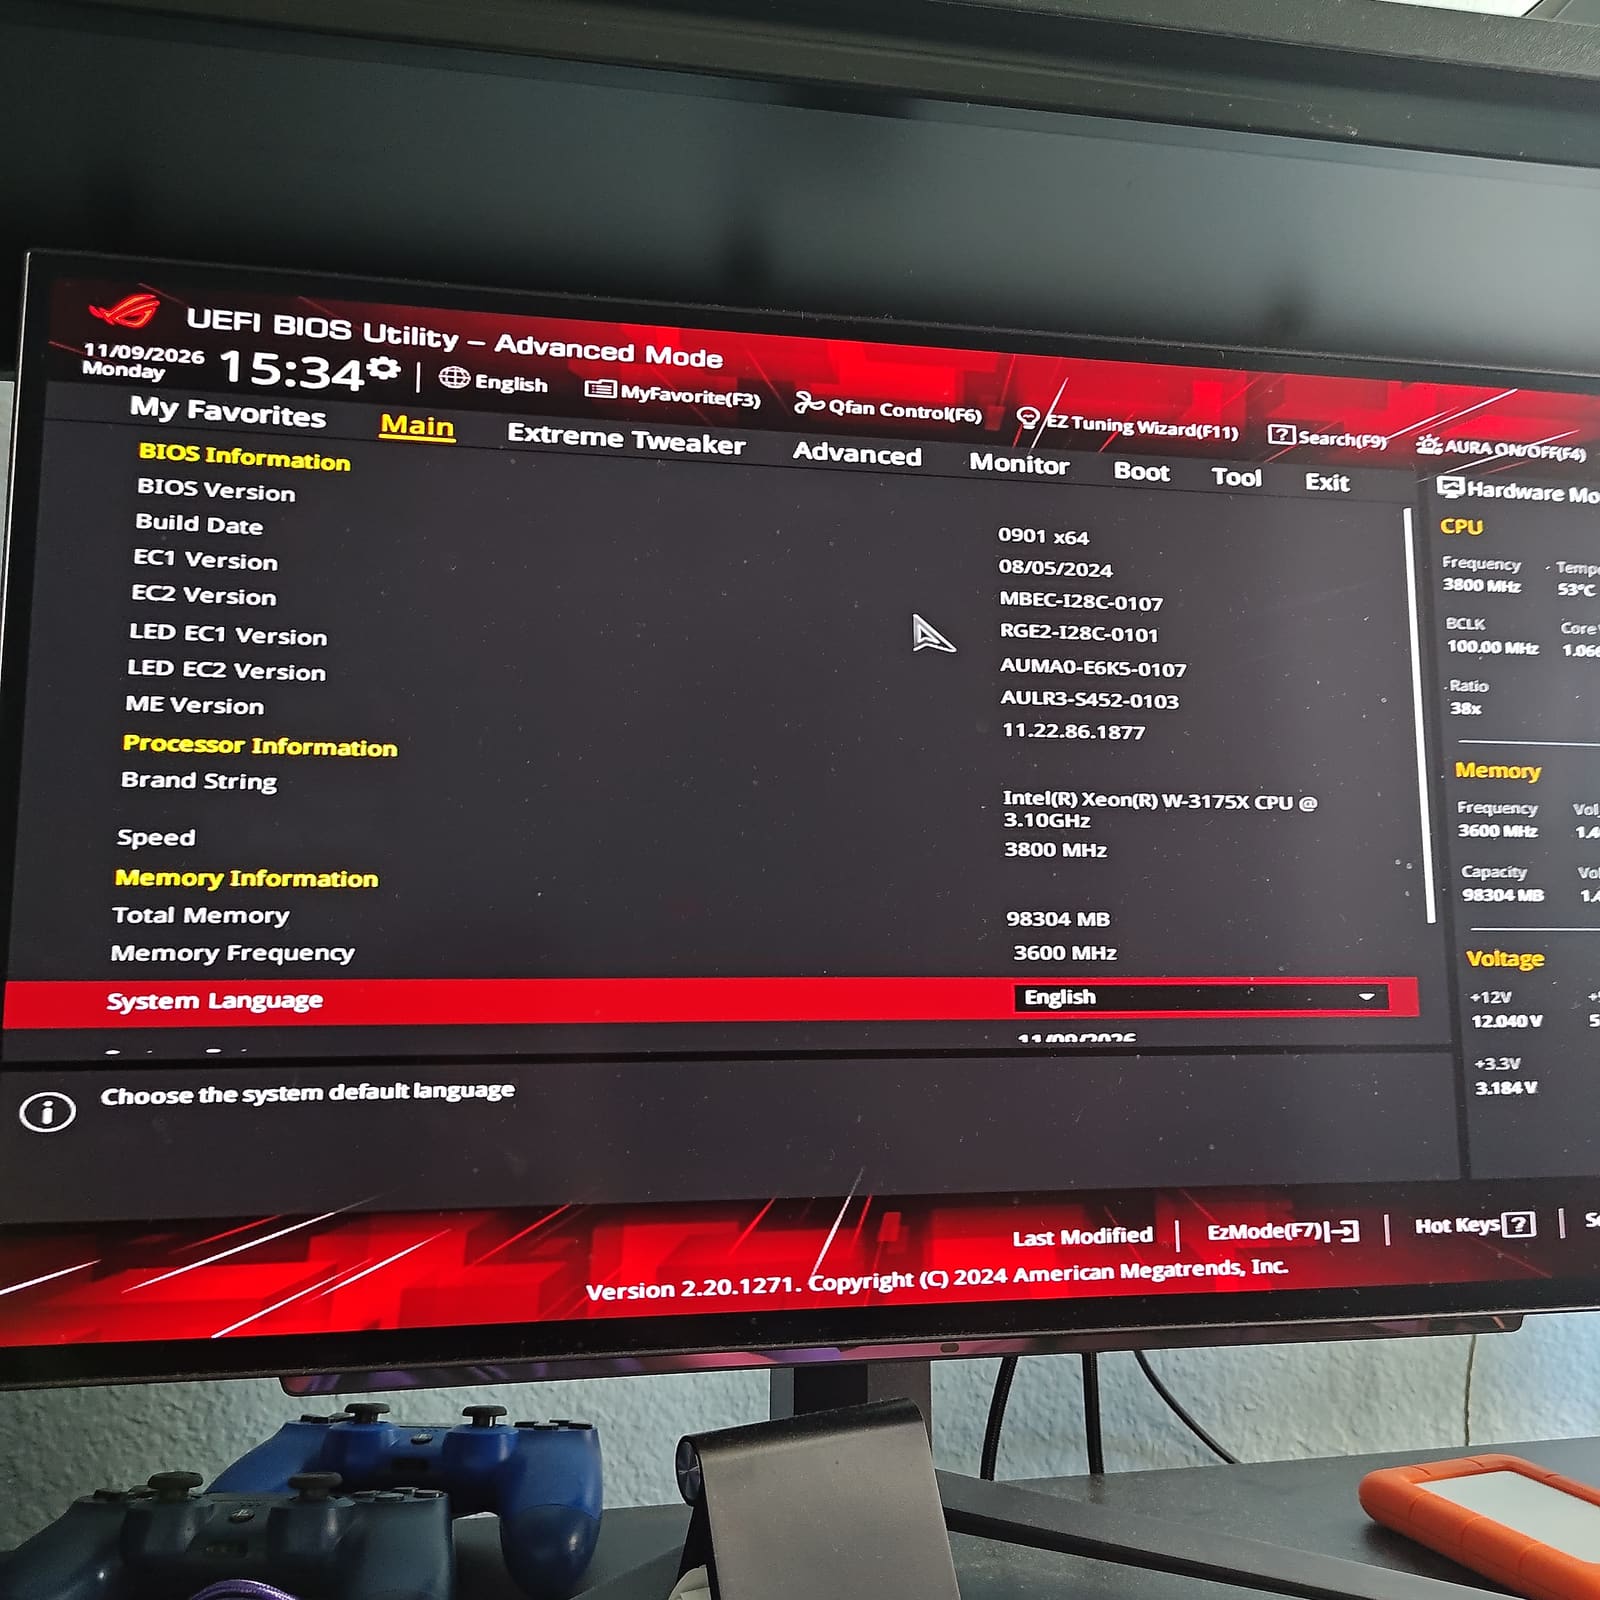
2 — Main page: BIOS 0901, ME 11.22.86.1877, 98304 MB at 3600 MHz.
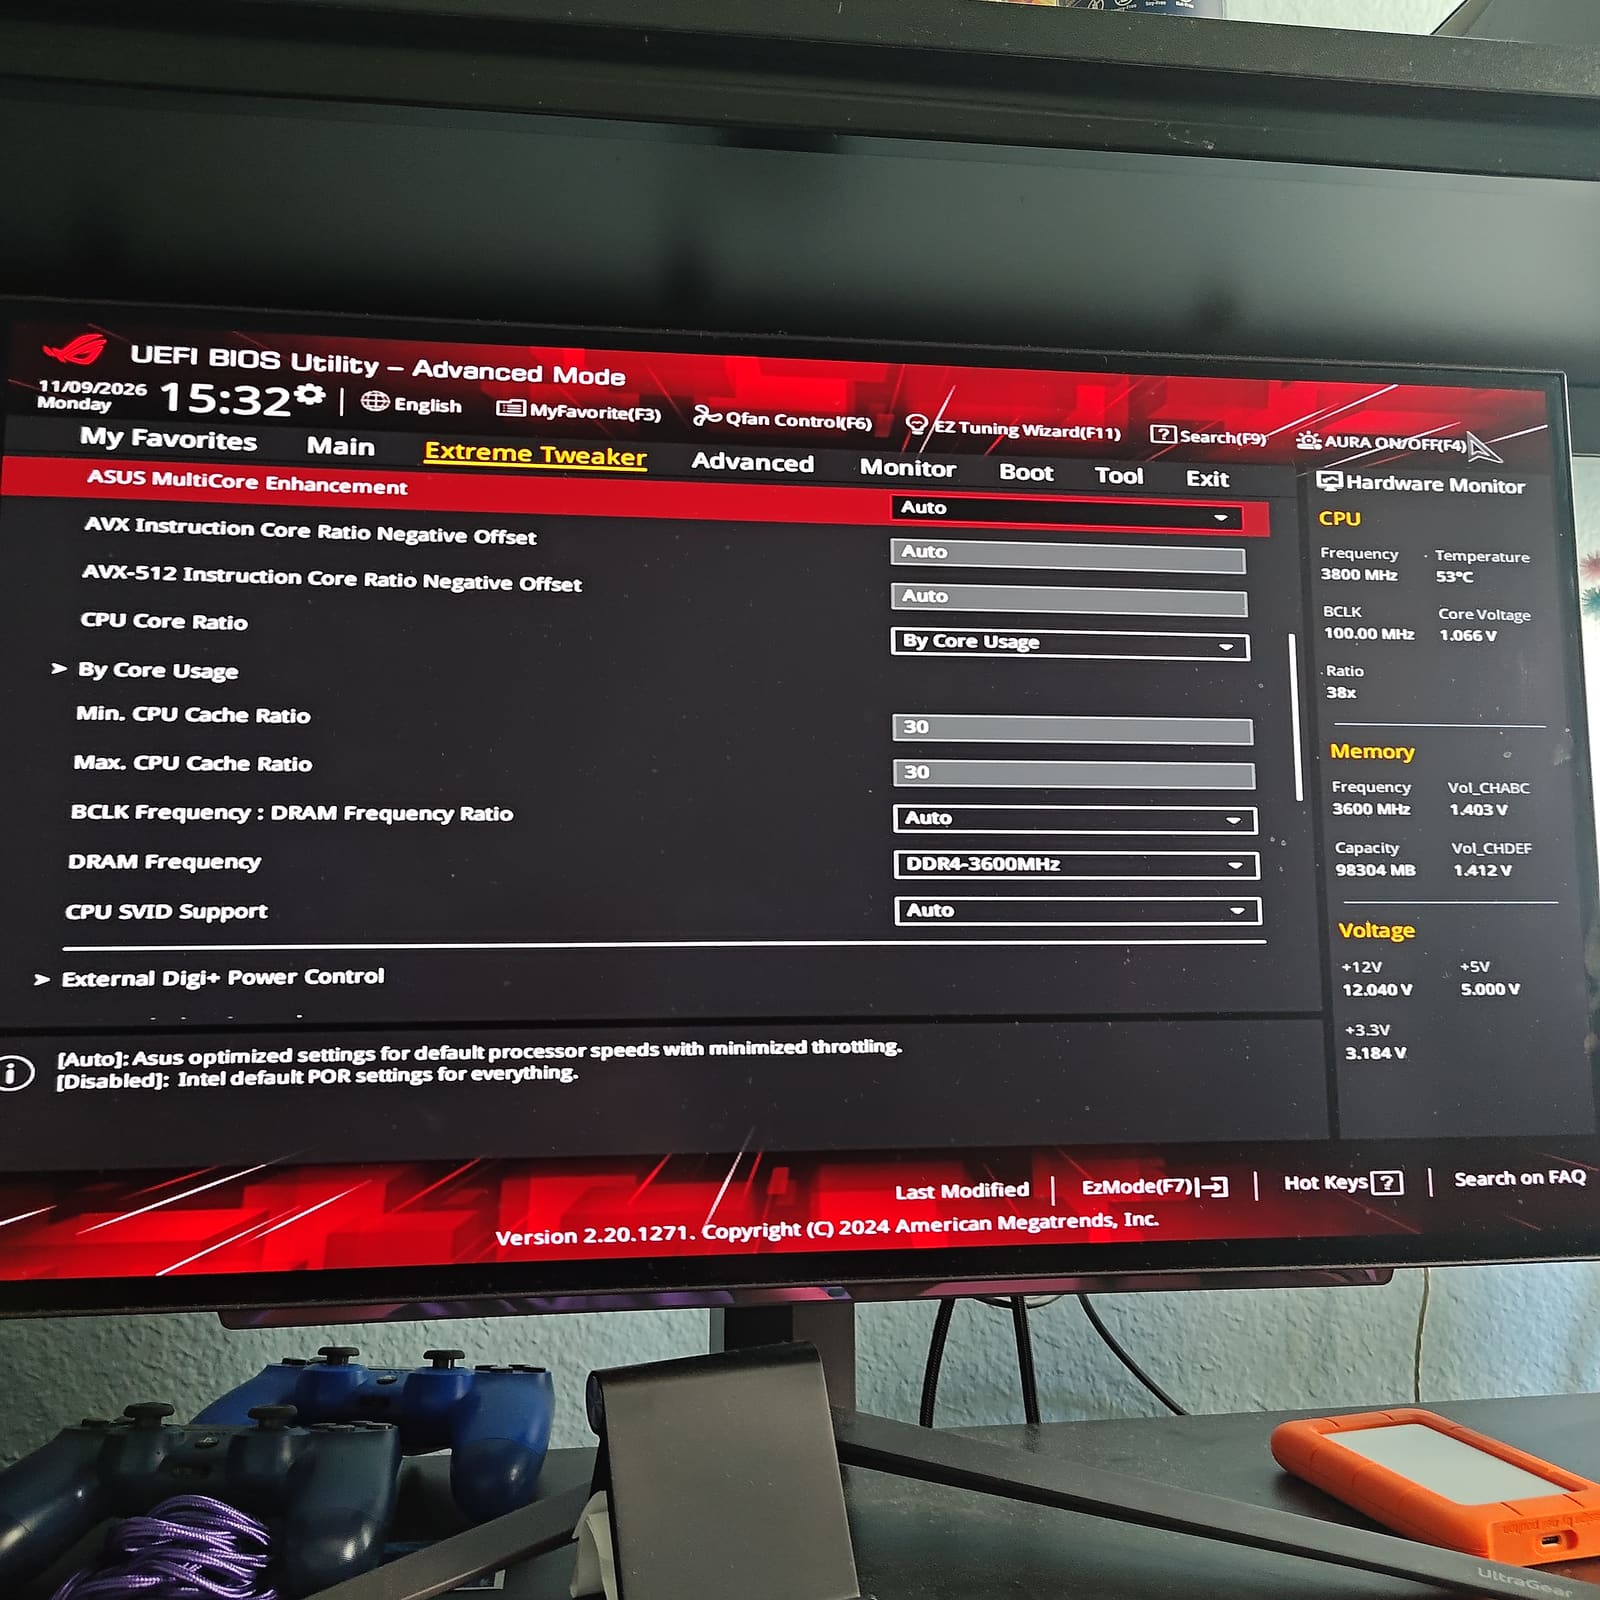
4 — MCE on Auto, cache ratio min and max both 30.
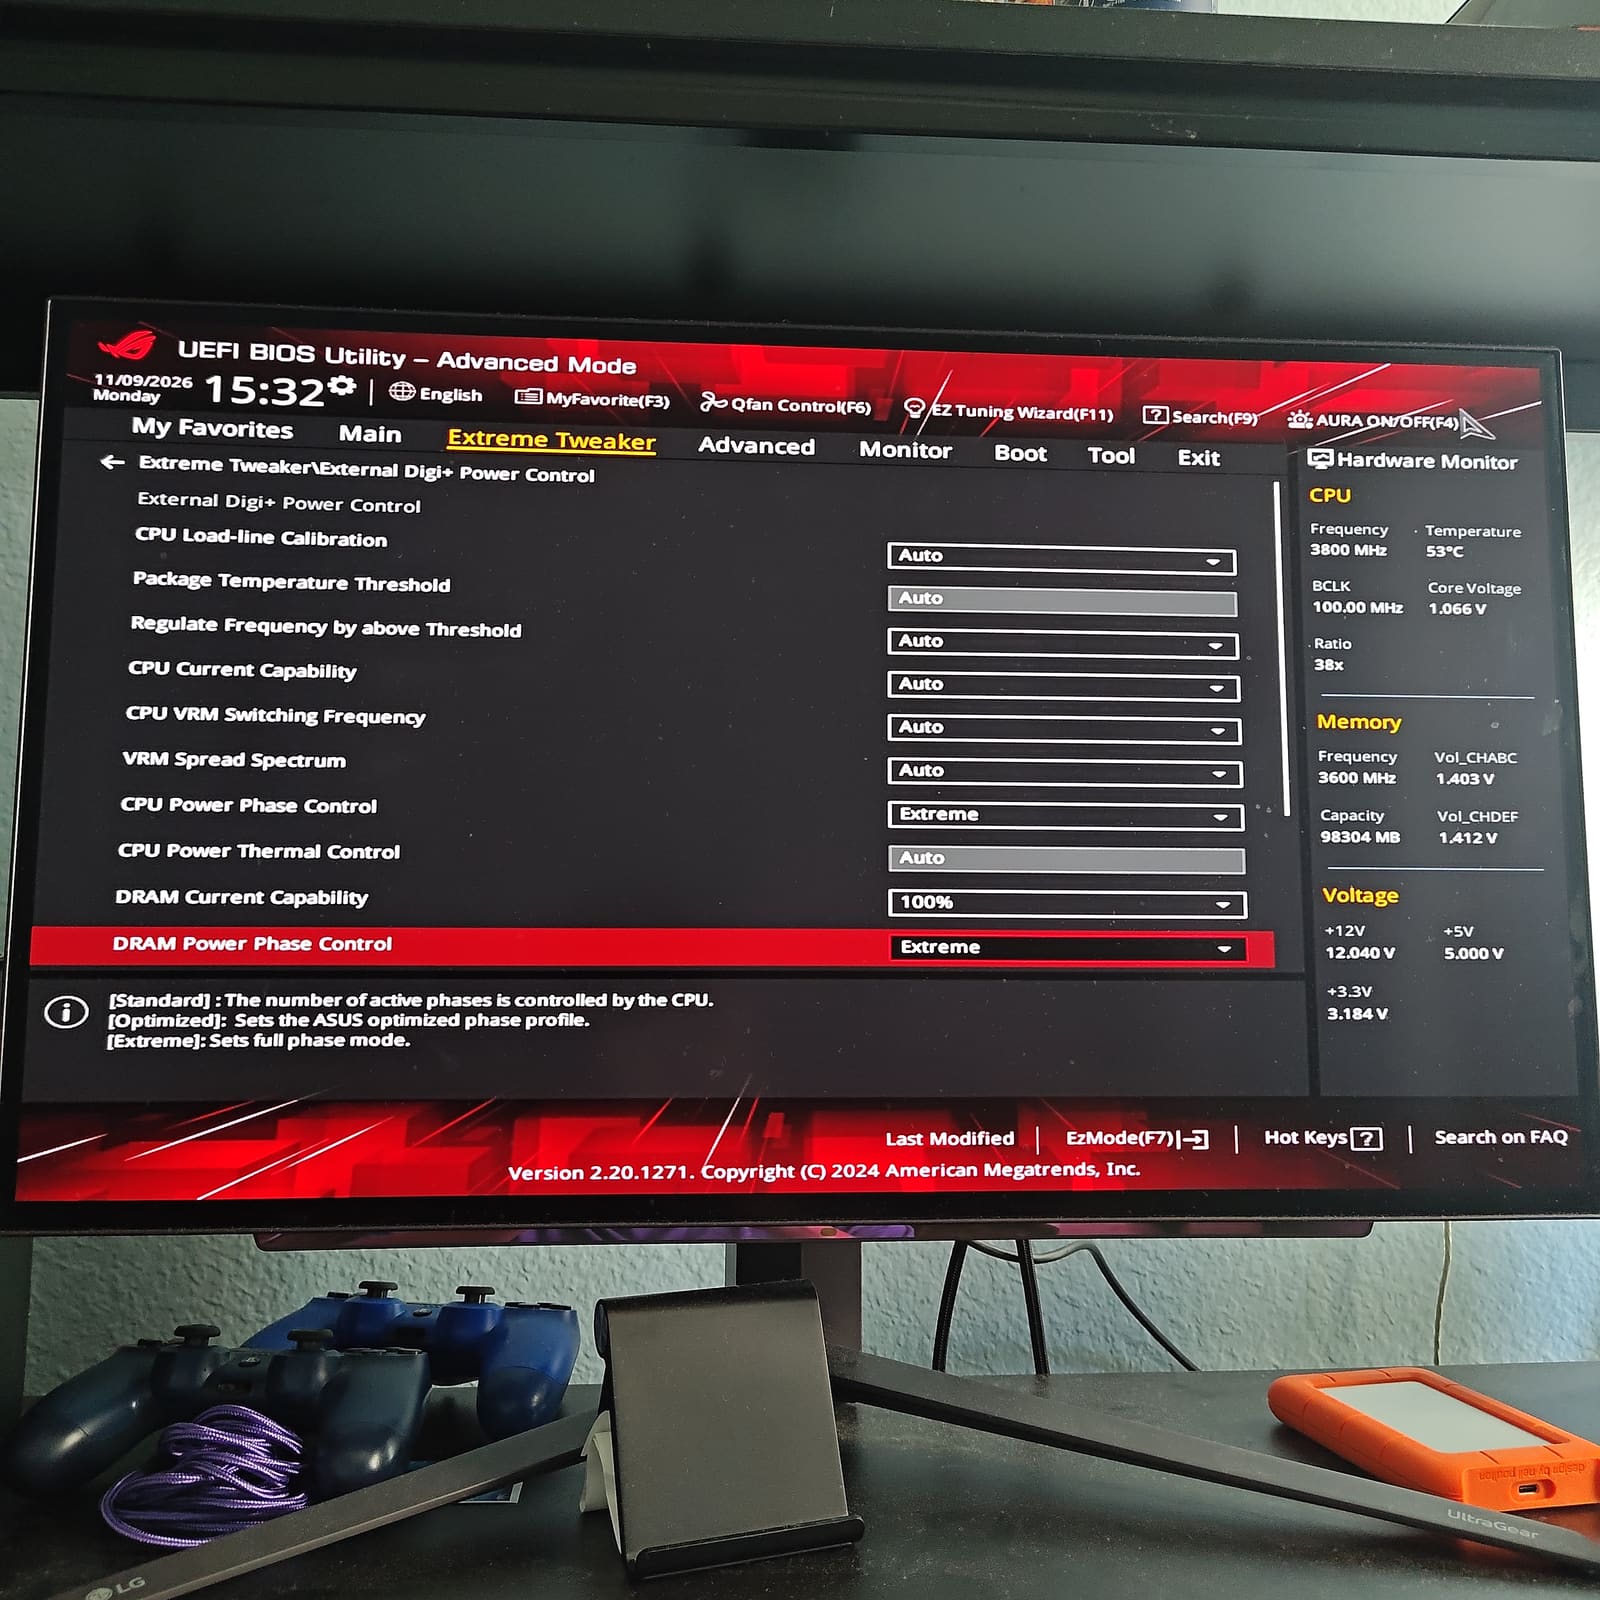
6 — Digi+ page: LLC Auto, CPU and DRAM phase control Extreme, DRAM current capability 100%.
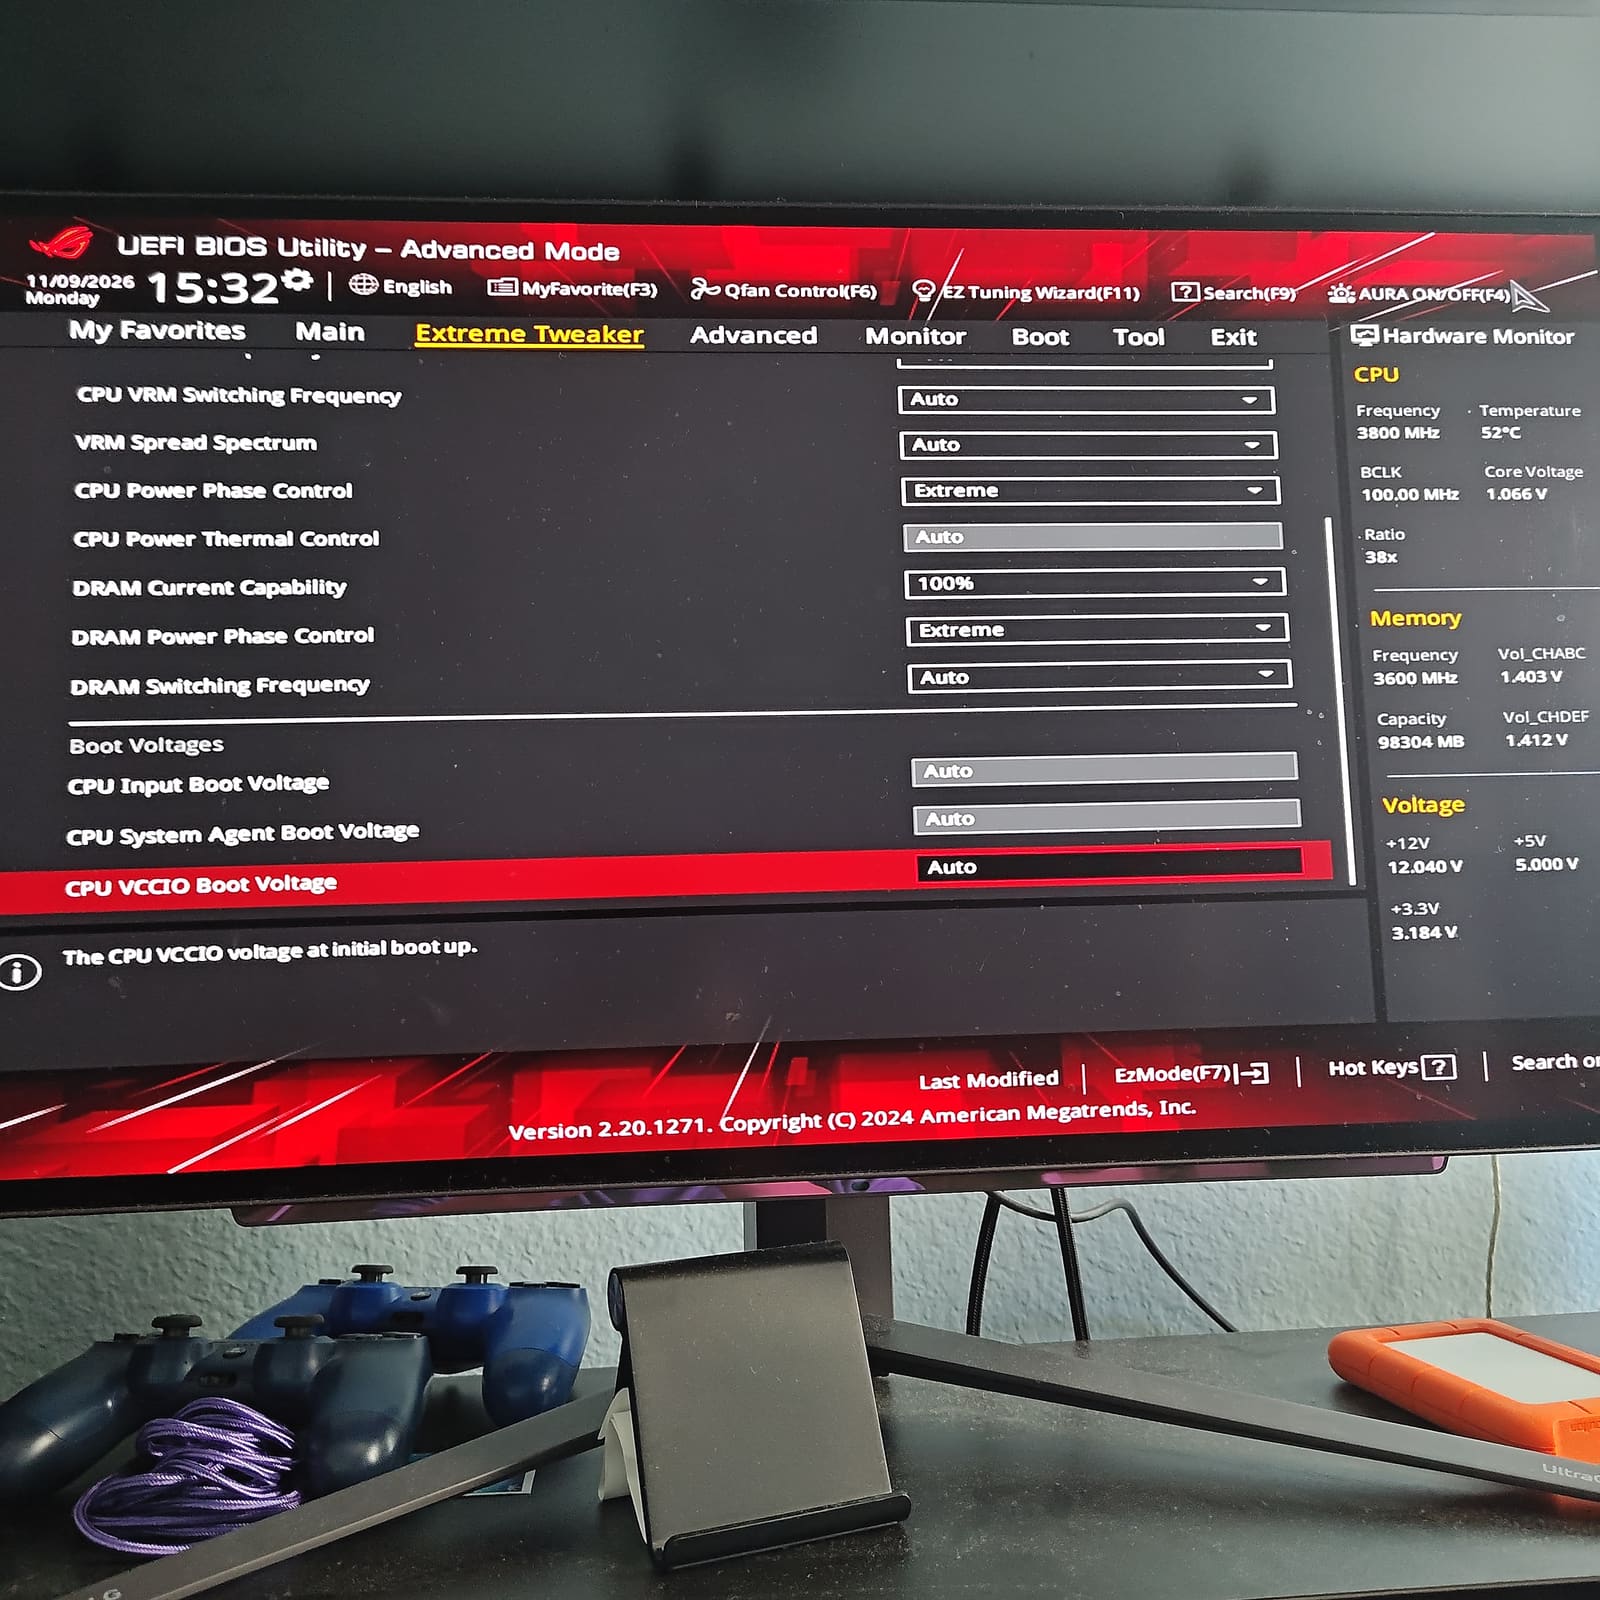
7 — Same page scrolled down: boot voltages all Auto.
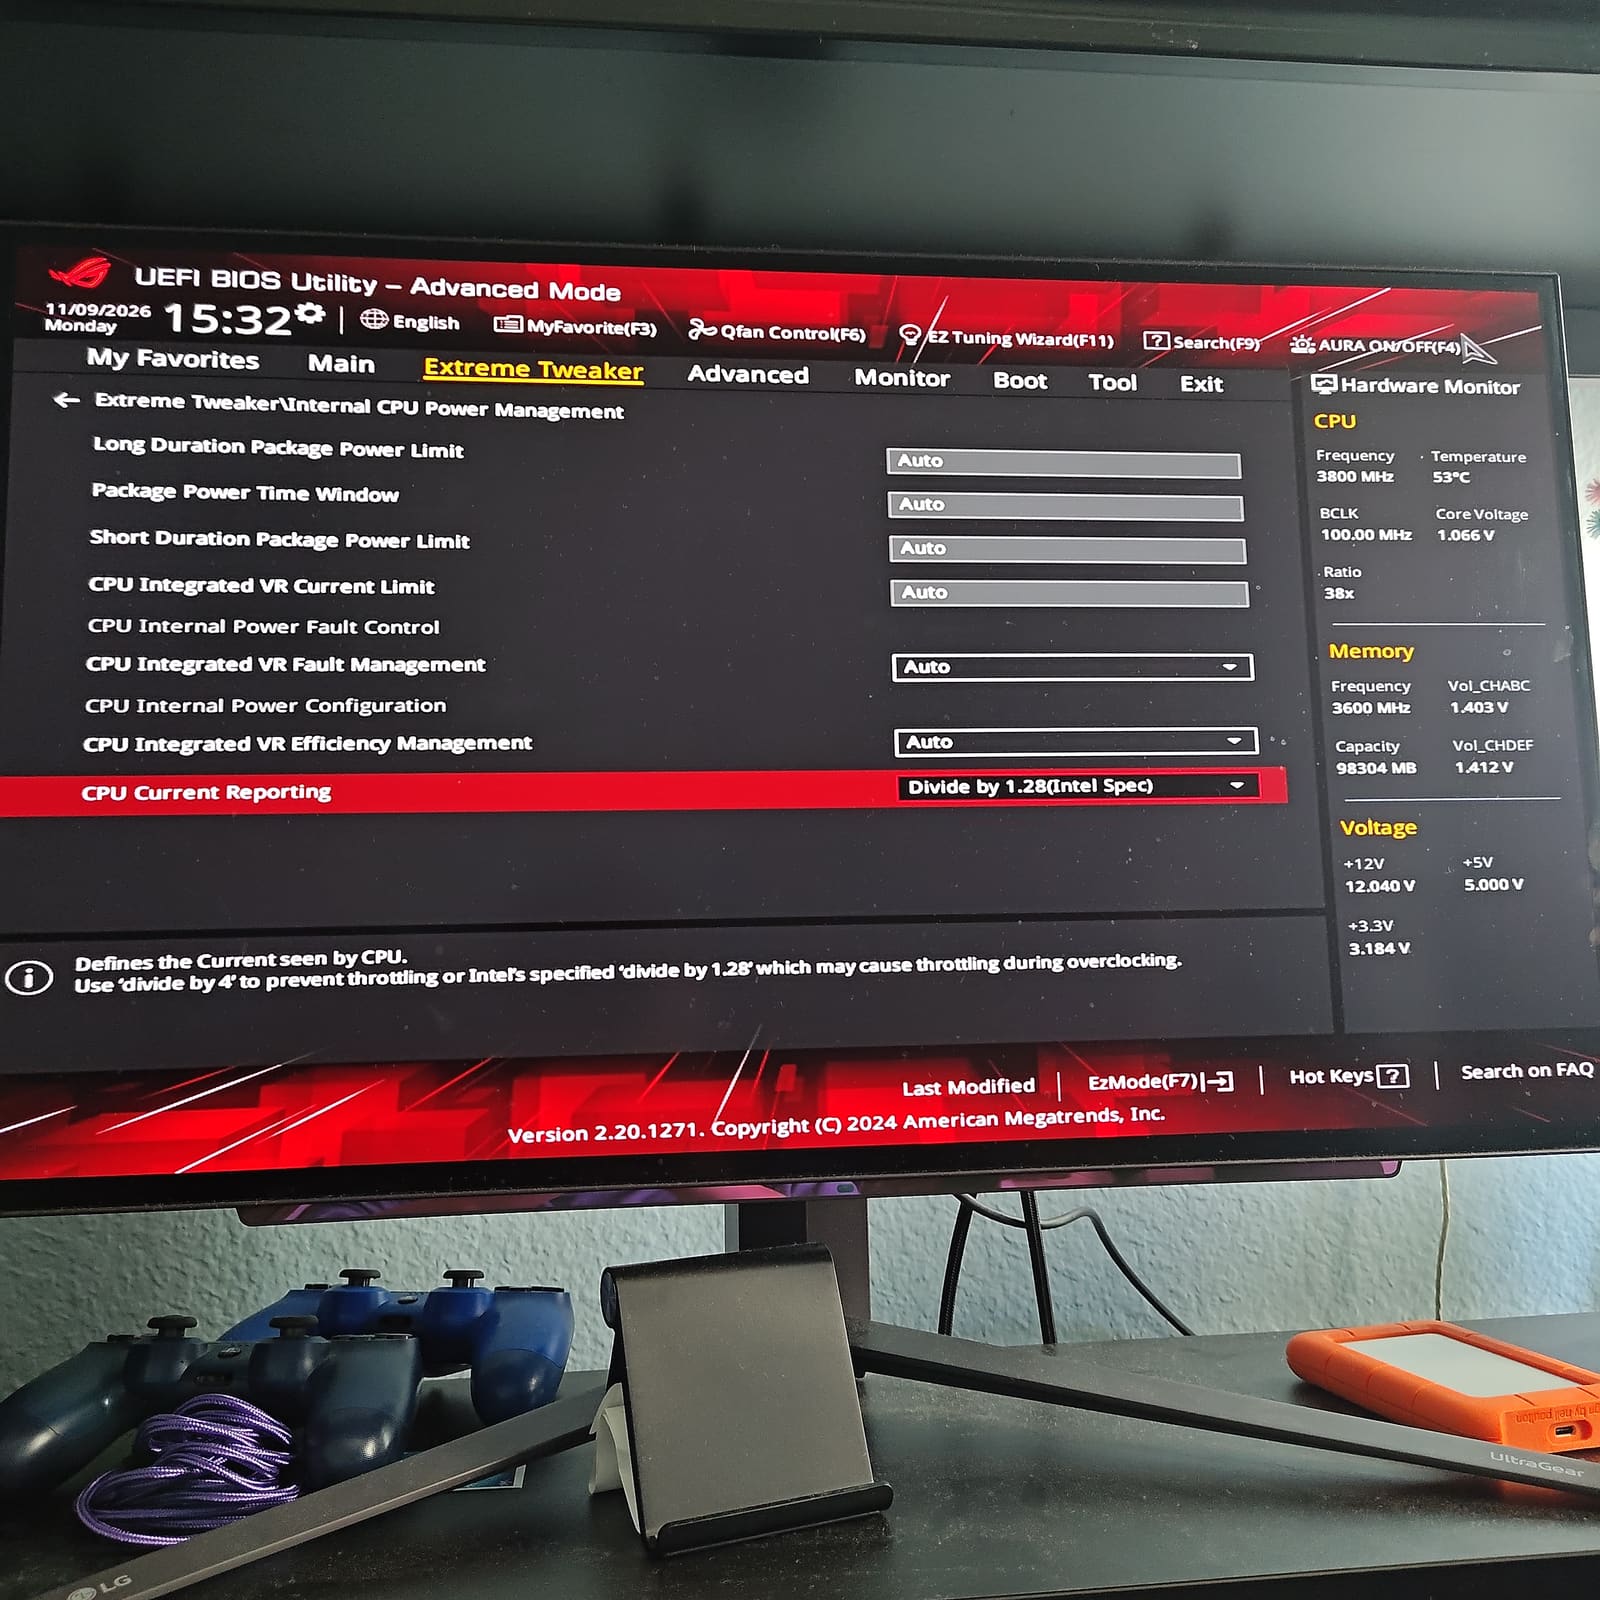
8 — CPU Current Reporting on “Divide by 1.28 (Intel Spec)”.
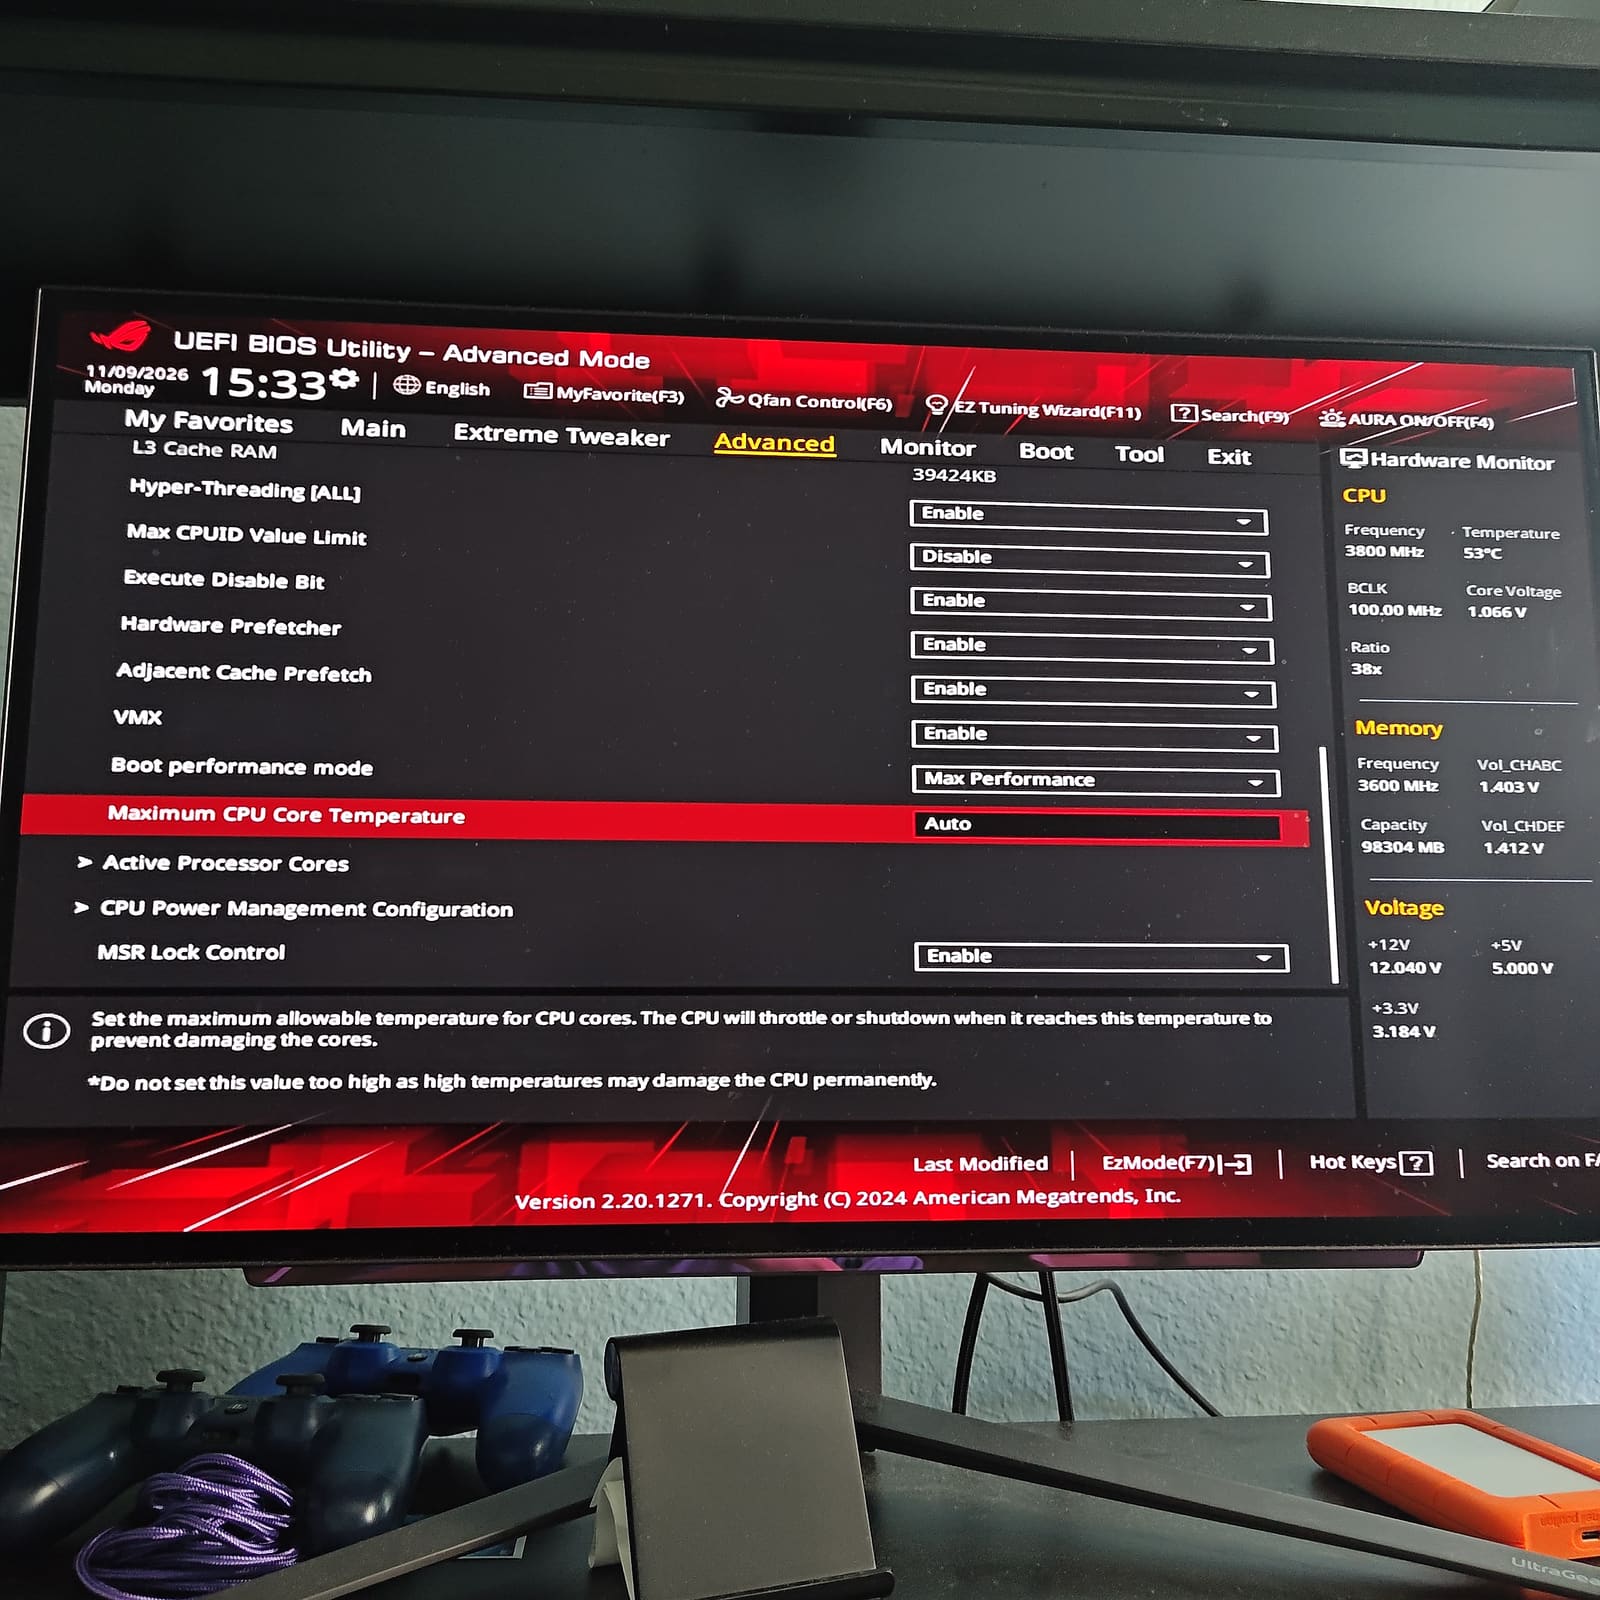
9 — Maximum CPU Core Temperature, on Auto.
Picture 9 is just a fun one. The BIOS has a Maximum CPU Core Temperature setting and warns not to set it too high because that can damage the CPU permanently. So in theory you could type in an absurdly high number and see what happens. I did not do that, and I’m not telling you to either. I just think it’s funny that the option’s sitting right there.
What the BIOS reads
The voltage page puts readouts next to the setpoints:
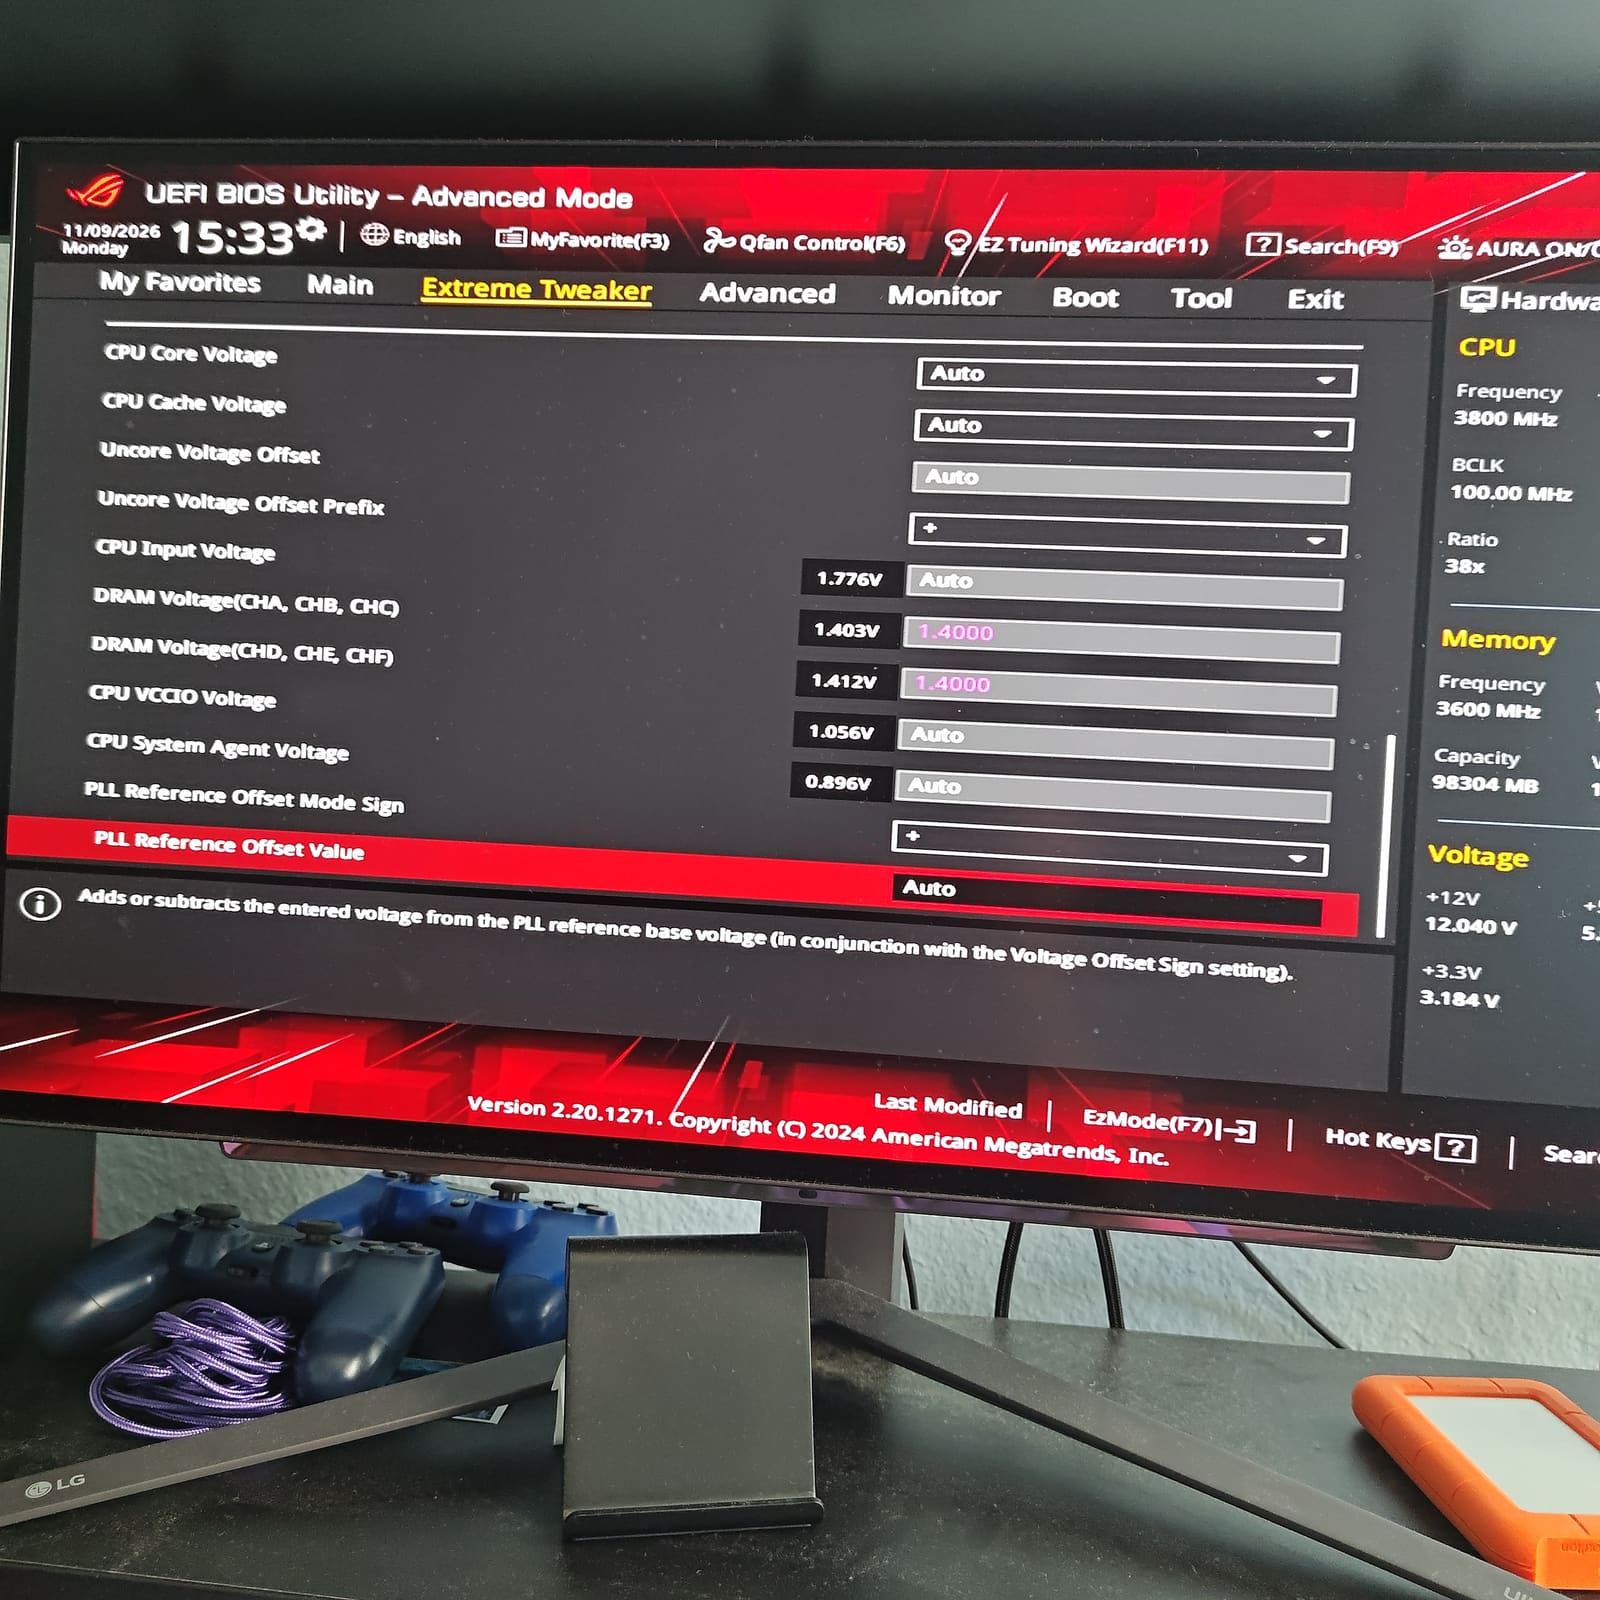
5 — Voltage page.
| BIOS setting | Setpoint | Readout |
|---|---|---|
| CPU Input Voltage | Auto | 1.776 V |
| DRAM (CHA, CHB, CHC) | 1.4000 | 1.403 V |
| DRAM (CHD, CHE, CHF) | 1.4000 | 1.412 V |
| CPU VCCIO | Auto | 1.056 V |
| CPU System Agent | Auto | 0.896 V |
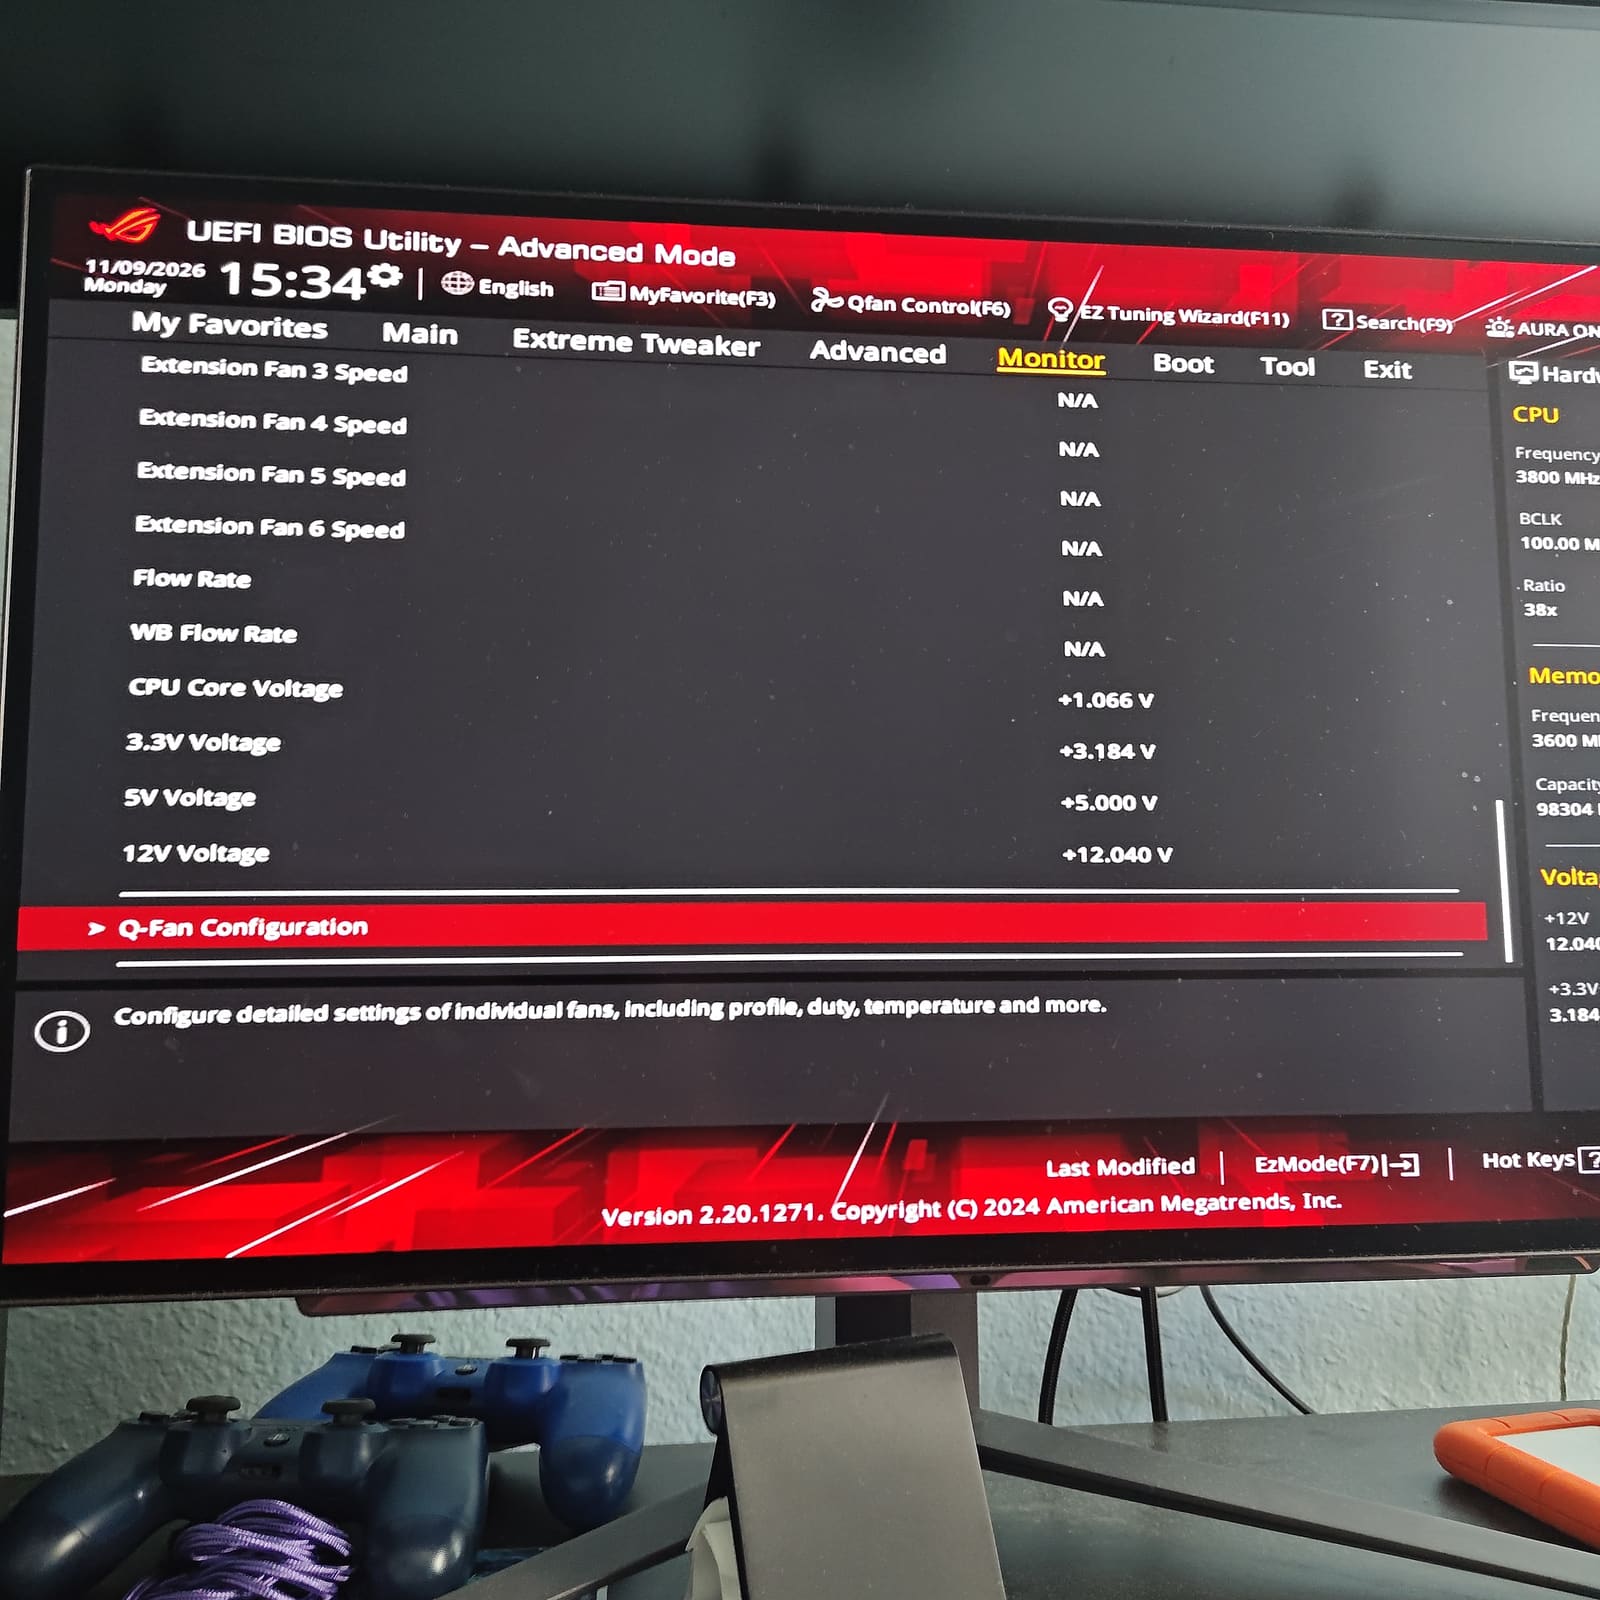
3 — Monitor page: CPU Core Voltage 1.066 V.
Important: these were read in the BIOS, where the CPU sits at 38x / 3800 MHz. My idle probing and the idle HWiNFO screenshots were done in Windows at the desktop. Those are two different states, so any BIOS-vs-probe comparison below is a loose cross-check, not a same-moment match.
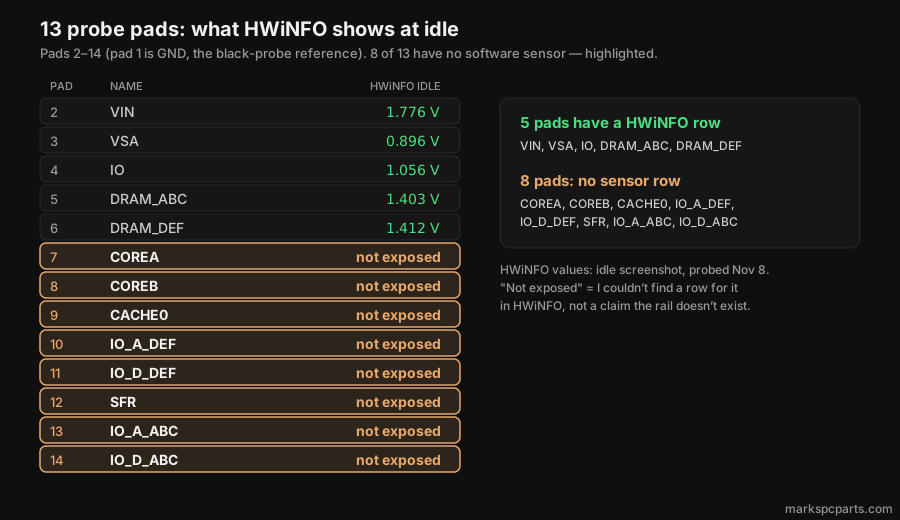
The five rail readouts above are identical to HWiNFO’s idle numbers. That’s possibly the same sensor, but I haven’t confirmed it.
HWiNFO: idle and load
I’m matching HWiNFO’s VCCIN, CPU VCCSA, VCCIO and DRAM rows to the pads by name.
Idle — Windows at the desktop, November 8:
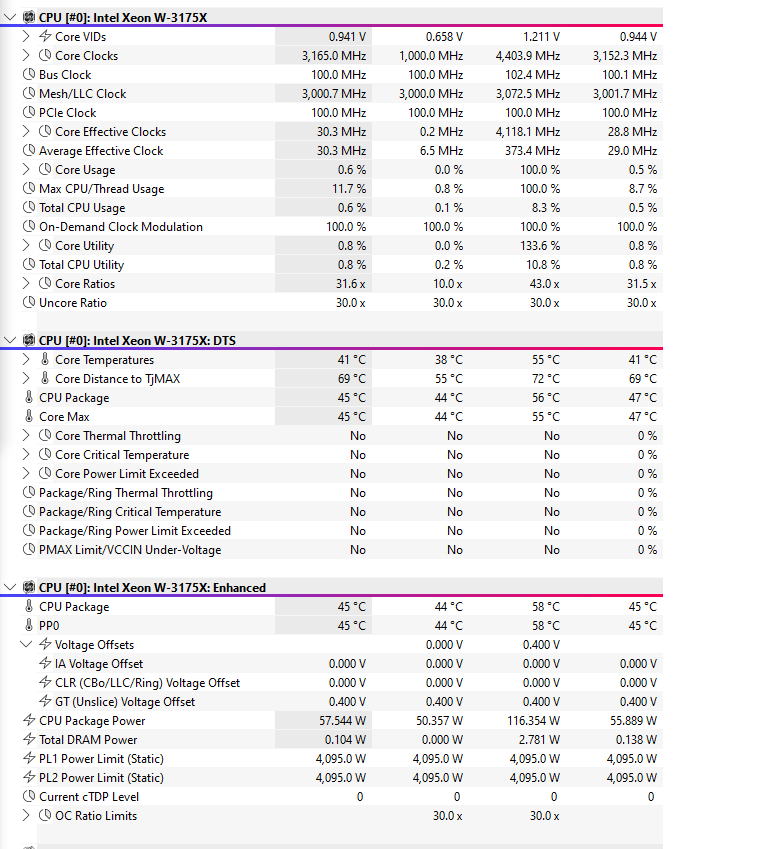
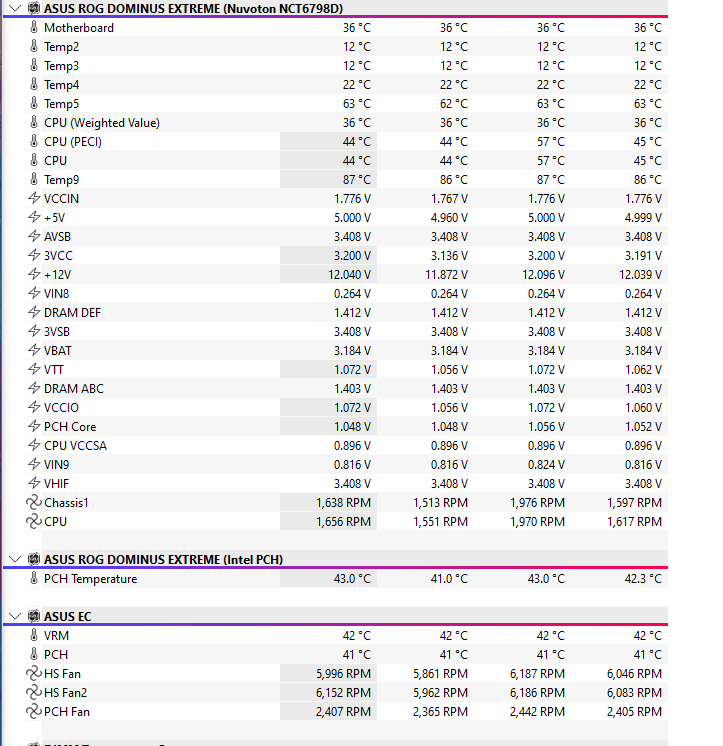
Under load — November 9, Cinebench R23 multi-core, a 30-minute run, at 38x:
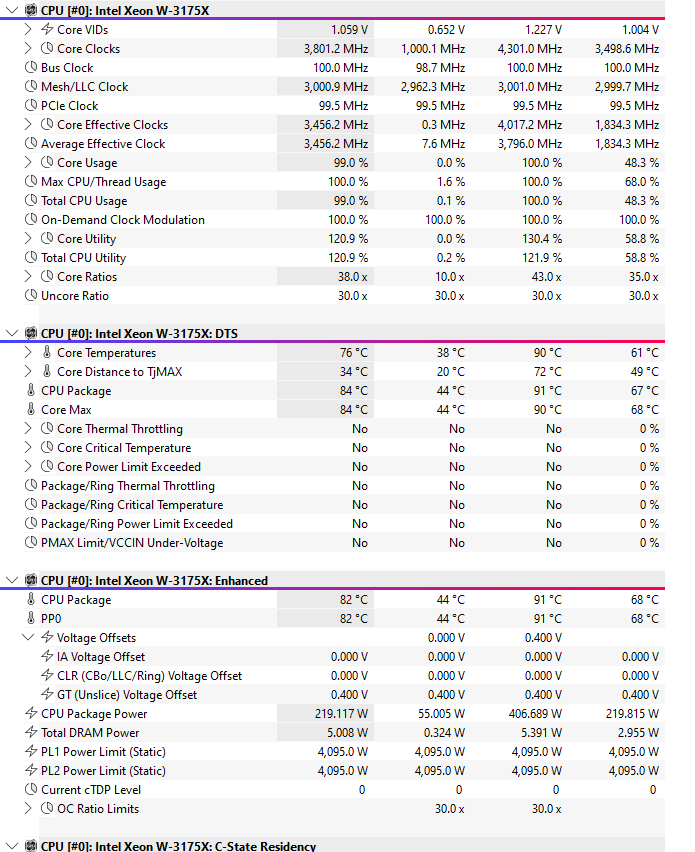
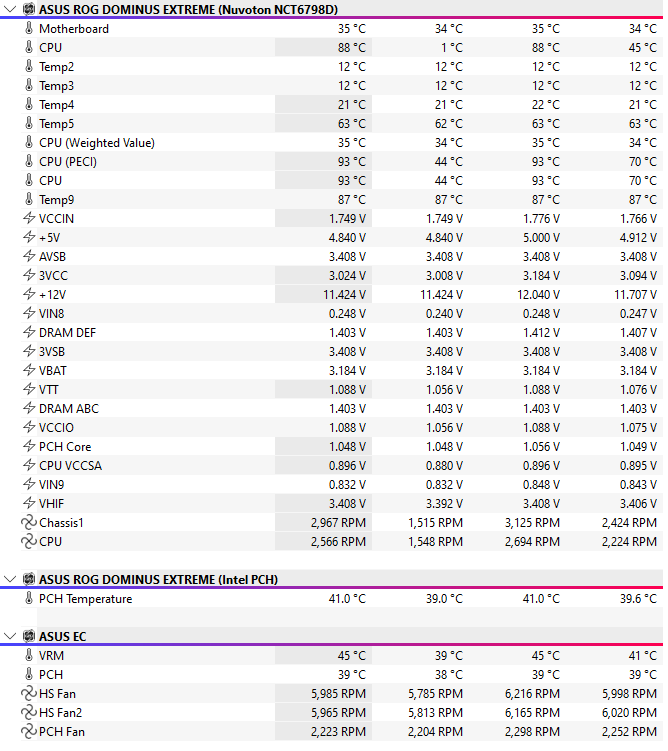
- CPU Package Power as shown by HWiNFO: the idle screenshot caught about 50–58 W, but that was probably bad timing. In normal use idle jumps around for me, somewhere in the 60–110 W range (the same screenshot shows a 116 W max). Under load the peak was 407 W. A normal Cinebench pull on this chip with these settings is 400–410 W for me. The 219 W average in the screenshot is low because the system sat idle for a bit before the test started.
- CPU Current Reporting changes that number. Auto had it on divide by 4, and from memory Cinebench only showed about 130–150 W like that. On Intel Spec it reads 400–410 W, so it’s the closest number to the true wattage in HWiNFO, as far as I can tell.
- Core temps reached 90°C under load. I know this sounds crazy, but from what I’ve seen PROCHOT / TjMax on this board is around 110°C (HWiNFO’s distance-to-TjMax rows work out to 110 too). This is just the 3175X doing 3175X things! This chip usually runs 92–98°C in Cinebench for me, so the 90 is just a bad screenshot again, and the Alphacool is working its ass off as a 360!- HWiNFO has no core-voltage row, only VID, which is what the CPU requests, not what’s on the pad.
- HWiNFO’s VCCIO flickered between 1.056 and 1.072 V during the idle capture. I’m using 1.056, which the BIOS readout also showed.
Idle values for every pad. Eight of the thirteen have no sensor row:
Probe time
The sheet I wrote on while I had the probes on the board:
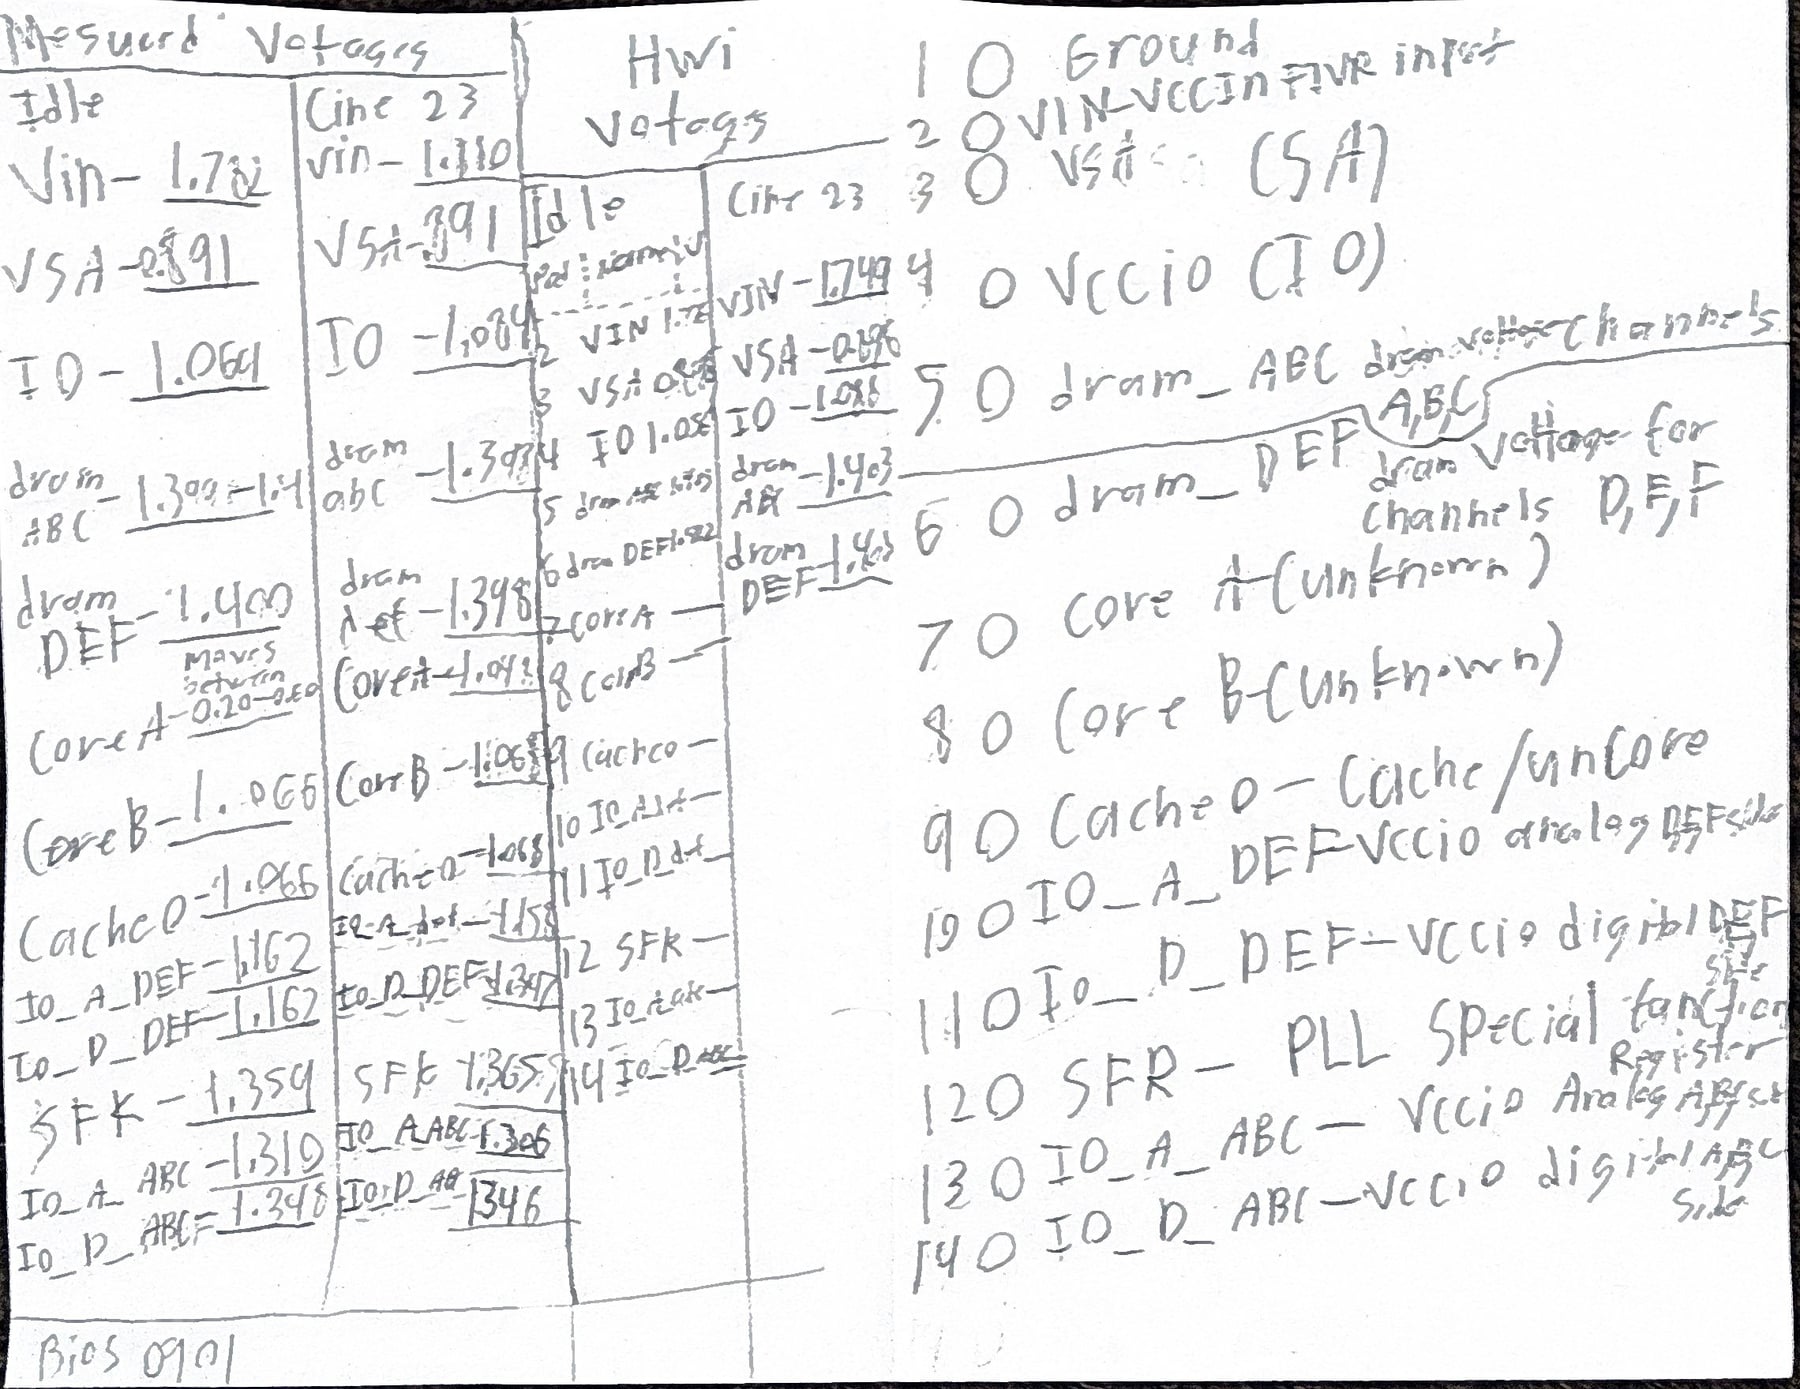
That’s just the raw picture. Every number in this post comes from the typed-up data, not from squinting at my handwriting.
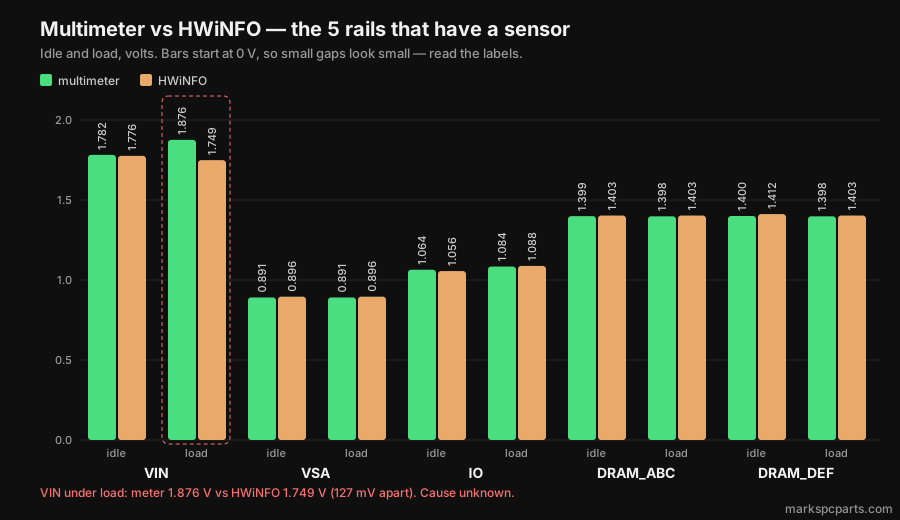
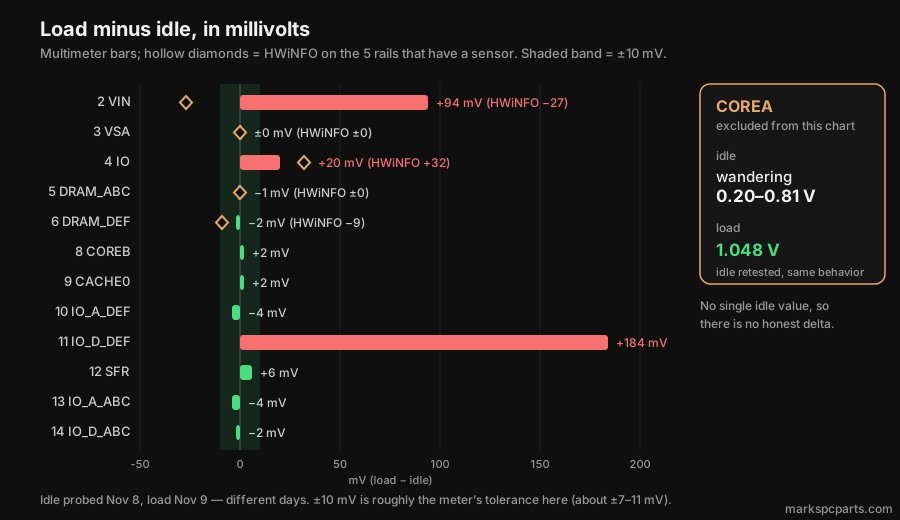
Pad by pad: meter idle / HWiNFO idle / meter load / HWiNFO load.
- VIN (2): 1.782 / 1.776 / 1.876 / 1.749. Idle agrees within 6 mV; under load they’re 127 mV apart. I took four readings under load (1.875–1.880 V), so it’s not a one-off glitch. I don’t know why. Possible explanations only, not facts: HWiNFO’s sensor and the pad might sit at different points on the power path, and/or LLC is on Auto.
- VSA (3): 0.891 / 0.896 / 0.891 / 0.896.
- IO (4): 1.064 / 1.056 / 1.084 / 1.088.
- DRAM_ABC (5): 1.399 / 1.403 / 1.398 / 1.403.
- DRAM_DEF (6): 1.400 / 1.412 / 1.398 / 1.403. The 12 mV idle gap is the biggest apart from VIN under load, and it’s close to the meter’s error bar — but my meter read both DRAM rails within 1 mV of each other (1.399 vs 1.400), so the gap looks like it’s in HWiNFO’s reading, not on the pads (same meter, same error on both).
So on those five rails, the meter and the board’s sensor agree within about 12 mV, except VIN under load.
- COREA (7): at idle the reading wandered 0.20–0.81 V (retested, same behavior). Under load it settled at 1.048 V. That’s consistent with power gating at idle, unconfirmed — no C-state data, no resistance check. No single idle number, so no delta.
- COREB (8): 1.066 idle, 1.068 load. The BIOS Core Voltage readout was 1.066 V, but that was read in the BIOS and my probing was in Windows, so it’s a loose cross-check, not a same-moment match. There’s no software number to compare against.
- CACHE0 (9): 1.066 idle, 1.068 load. It follows COREB, with the mesh locked at 30x.
- IO_A_DEF / IO_D_DEF (10, 11): 1.162 / 1.162 at idle. Under load IO_A_DEF stayed at 1.158 but IO_D_DEF jumped to 1.346.
- IO_A_ABC / IO_D_ABC (13, 14): 1.310 / 1.348 at idle, 1.306 / 1.346 under load.
Put those four together: at idle the DEF pads sit about 150–190 mV below the ABC pads, and under load IO_D_DEF comes up to match IO_D_ABC while IO_A_DEF stays put. No software sensor shows any of these. I don’t know why IO_D_DEF moved, and idle and load were probed on different days, so I can’t rule out something else changing.
SFR
The SFR pad is the one I couldn’t help being curious about.
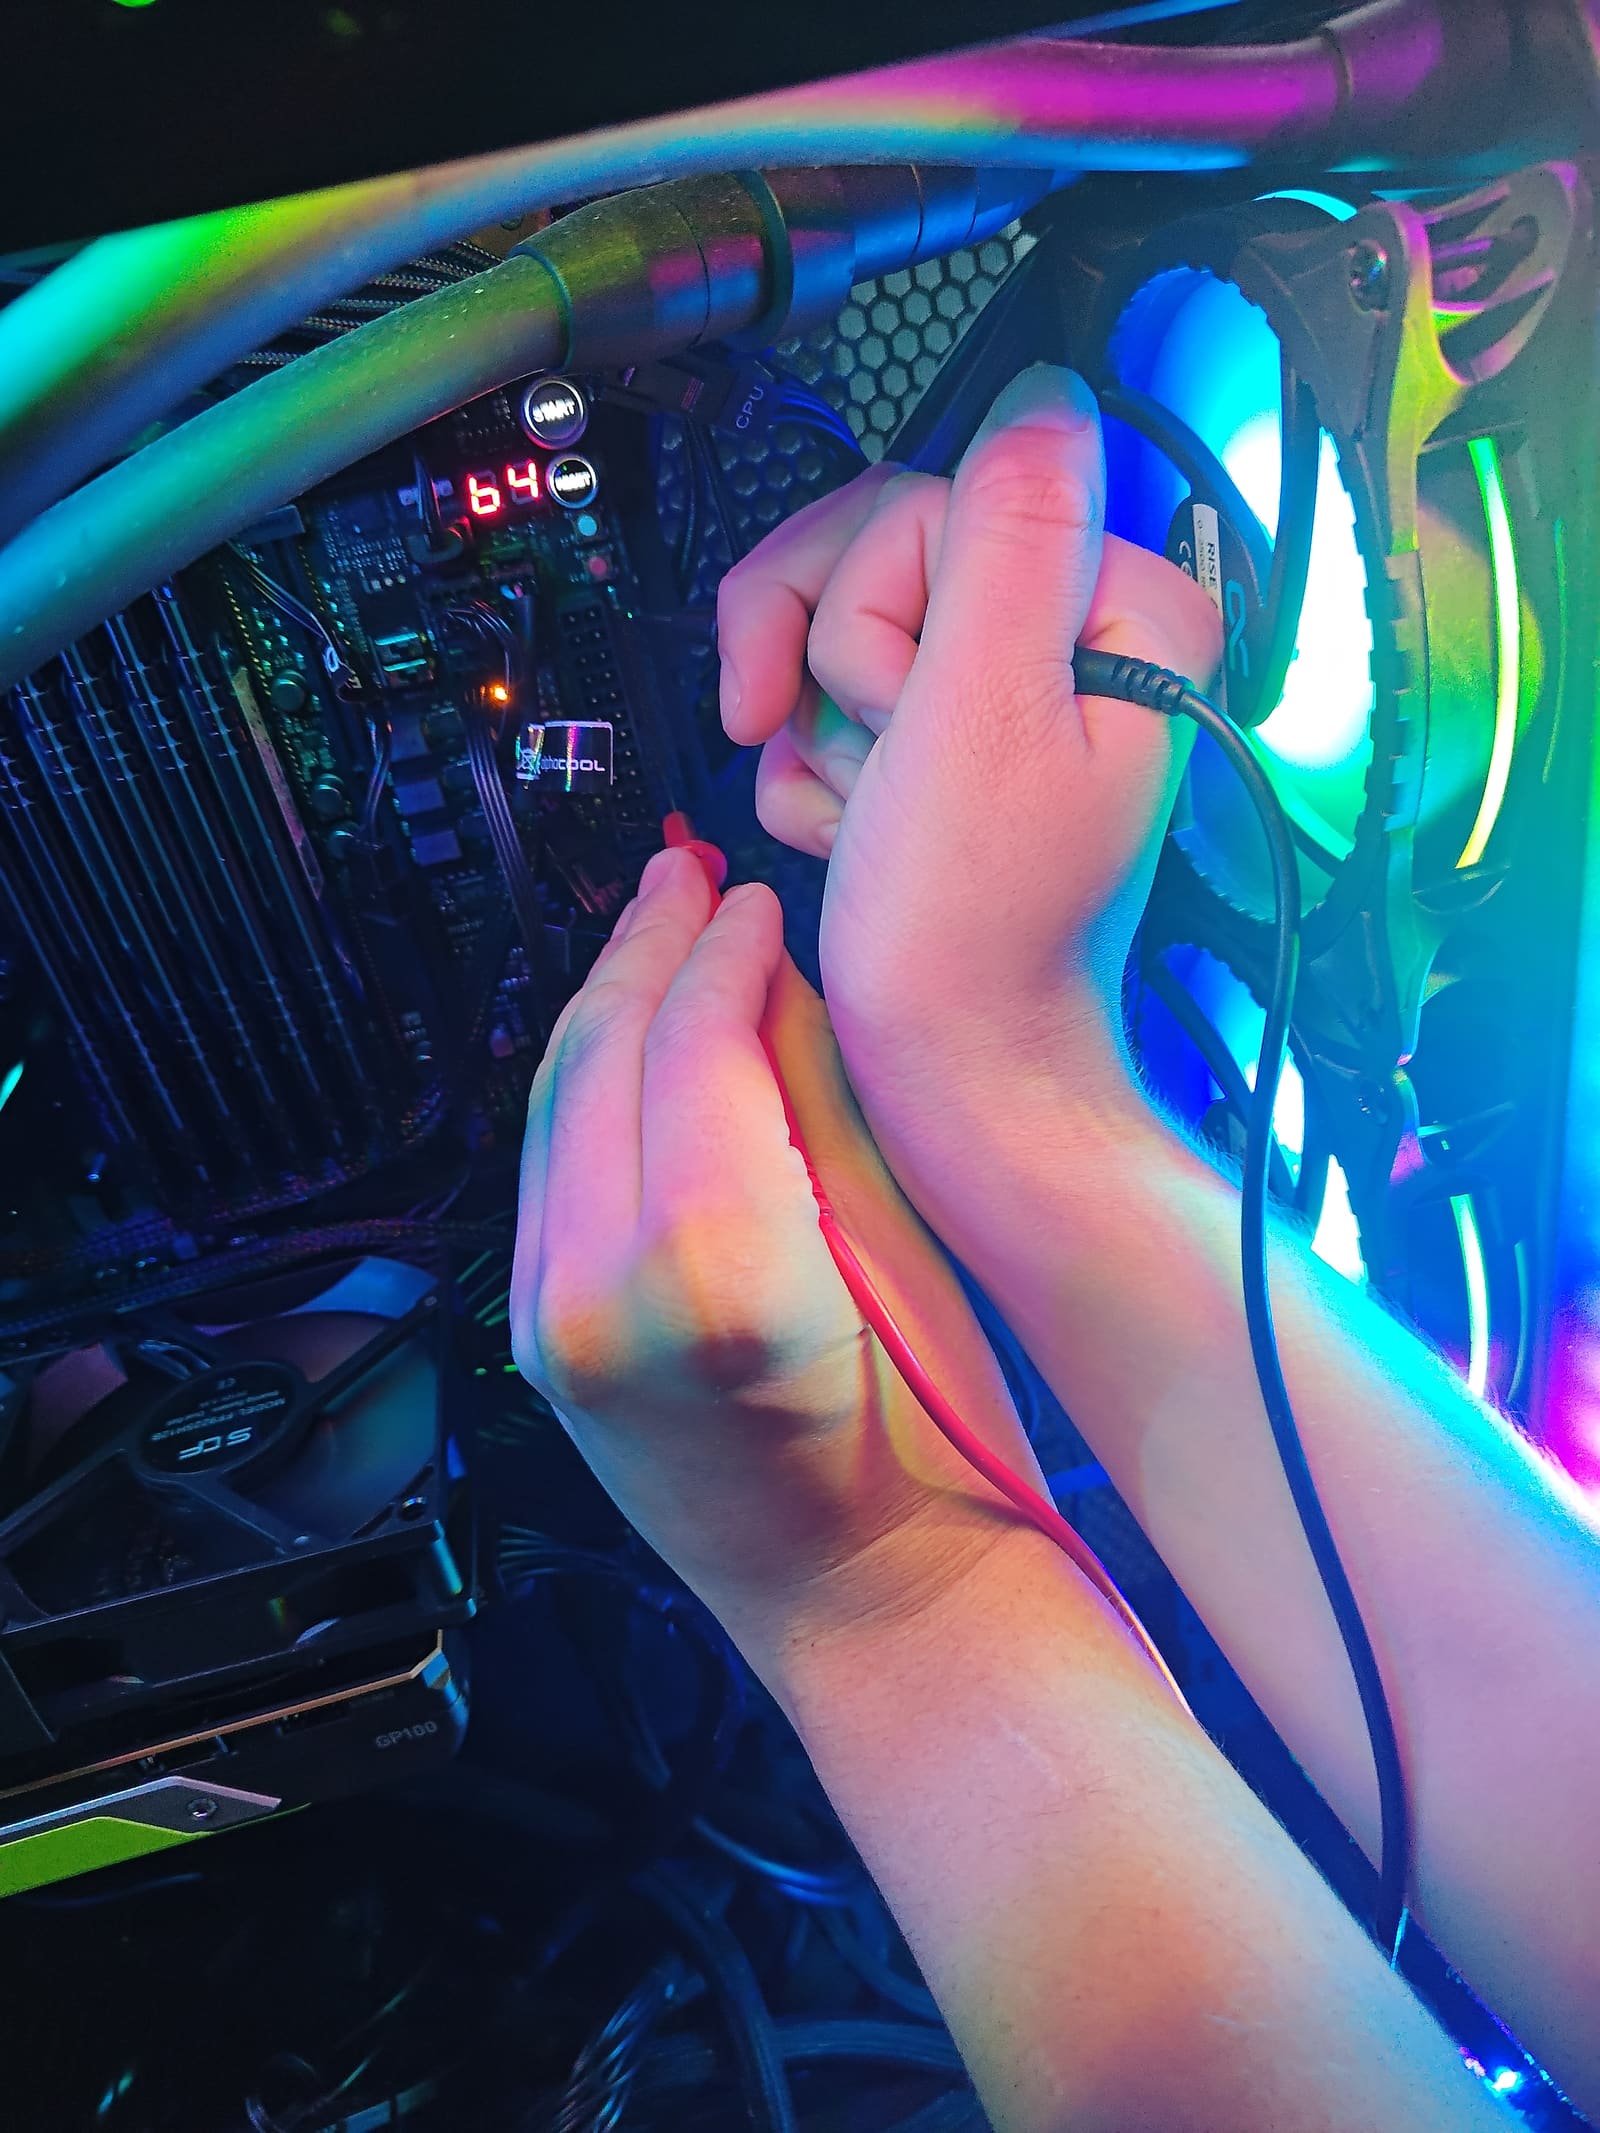
Probing the pads — you can’t see which pad the tip is on, so don’t read anything into this picture.
SFR (12): 1.359 V idle, 1.365 V load. Barely moved.
“SFR” is just a label on this board. On other Intel platforms it’s the PLL “special function register” supply, which is what I wrote on my sheet, but that’s unconfirmed for this board and ASUS doesn’t say. The label is a label. The reading is the finding.
What I found
In order, hedged:
- On the five rails with a sensor, the meter and the board sensor agree within about 12 mV, except VIN under load.
- VIN under load: meter 1.876 V (four readings, 1.875–1.880) vs HWiNFO 1.749 V. At idle they agree (1.782 vs 1.776). Cause unknown. Unconfirmed ideas: the sensor and pad are at different points on the power path, and/or LLC on Auto.
- COREB reads 1.066 V idle and 1.068 V load, loosely consistent with the BIOS Core Voltage readout (1.066), which was read in a different state (BIOS vs Windows). HWiNFO has no core-voltage row, only VID.
- COREA wandered 0.20–0.81 V at idle (retested, same behavior) and settled at 1.048 V under load. Consistent with power gating at idle, unconfirmed (no C-state data, no resistance check).
- IO rails at idle: DEF 1.162 / 1.162 vs ABC 1.310 / 1.348, about 150–190 mV apart. Under load IO_D_DEF jumps to 1.346, matching IO_D_ABC, while IO_A_DEF stays at 1.158. No software sensor shows any of these four. Caveat: idle was probed Nov 8 and load Nov 9.
- SFR 1.359 idle, 1.365 load. CACHE0 follows COREB (1.066 to 1.068) with the mesh locked at 30x.
Limits
- A 3½-digit handheld meter: roughly ±7–11 mV at these voltages by the published spec, and about 2–3 readings per second, so no transients.
- Almost every number is a single read. Exceptions: VIN under load (four readings) and COREA at idle (retested).
- Idle and load were on different days (Nov 8 and 9). Idle was Windows at the desktop; the BIOS readouts were taken in the BIOS at 38x / 3800 MHz.
- Config: MCE Auto, LLC Auto, phase control Extreme, BIOS 0901. Load: Cinebench R23 multi-core, 30 minutes, 38x.
- HWiNFO values are single screenshots (Current column).
Not done yet / next
- A resistance check of COREA vs COREB
- HWiNFO C-state residency
- Idle and load in the same session
- LLC levels
- A scope for transients
- A tuned-config follow-up
Disclaimer
I’m 19 and just messing around with a multimeter. One board, one CPU, one cheap meter. Take the numbers as what I measured, not as ASUS or Intel specs. Probing a live board is easy to get wrong.
That’s it for this one. More soon — I’ve got a lot of projects stacked up and I’m finally going to post them. If you’ve got a Dominus and a meter, probe yours and tell me what you get. I’d love to see if mine’s normal.
— Mark
ROG Dominus Extreme, Xeon W-3175X, 96 GB at 3600 CL15, BIOS 0901, Etekcity multimeter on the 2000 mV range. Thirteen probe pads measured at idle and under Cinebench load; five have a software sensor and most agree within about 12 mV, one doesn’t, and several causes are still unknown.